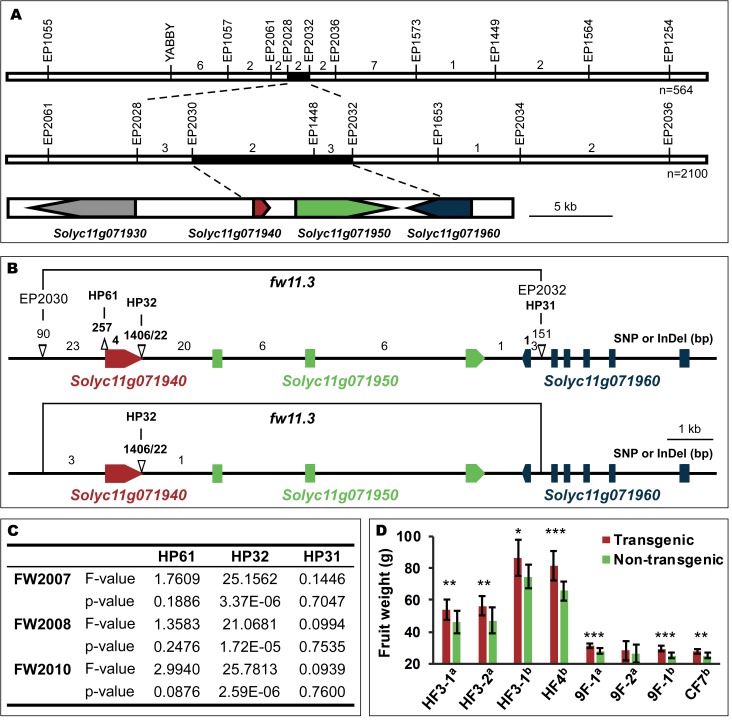
Fig 1. Cloning of the fw11.3 QTL.
(A) The fw11.3 locus was mapped to the EP2028-EP2032 interval on tomato chromosome 11. The fw11.3 locus was further narrowed down to EP2030-EP2032 interval including two and a half open reading frames. Numbers above the chromosome indicate number of recombinant plants in the respective interval that were progeny tested. The black region delineates the fine mapped locus on the genome. The three candidate genes are shown in red, green and blue. (B) The DNA polymorphisms at the fw11.3 locus among LA1589 and Howard German/Rio Grande (upper) or Yellow Pear and Gold Ball Livingston (lower) segregating populations. Bold numbers above the chromosome indicate polymorphisms in the coding region; non-bold numbers indicate polymorphisms in the non-coding region. EP2030, EP2030, HP61, HP32 and HP31 denote markers. Δ: deletion or insertion. (C) Association mapping results of fruit weight with markers HP61, HP32 and HP31. The years used to collect the data are shown as FW2007, FW2008 and FW2010. (D) Transgenic complementation tests. Average fruit weight of 10 to 13 plants from T1 generation transgenic and non-transgenic sib plants cultivated under the same growing conditions are shown. Error bar: standard deviation. HF, Howard German background and 9F/CF, VIR347 background. Data collected during the 2013 field season is denoted with an “a”. Data collected during the 2014 field season is denoted with a “b”. Significance determined by paired t-tests and transgenic (transgenically carrying the CSR-D allele) plants were compared to their non-transgenic (CSR-WT) sibs. *, p ≤ 0.05; **, p ≤ 0.01; ***, p ≤ 0.001.

