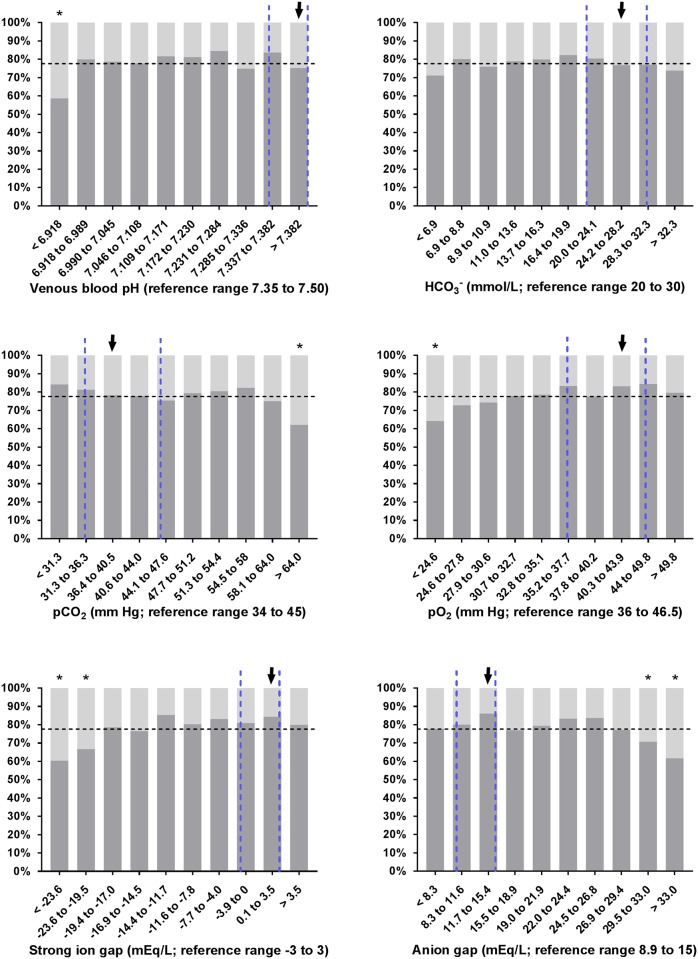
Fig 1. Observed survival rates of 1,400 critically ill neonatal calves with diarrhea in deciles of selected blood gas and acid-base variables.
Dashed vertical lines indicate the reference range of respective variables [7, 46, 51] and the dashed horizontal line indicates the overall survival rate of calves of this study population. Survival rates of decile groups that were significantly different (P ≤ 0.006) from the survival rate of the reference group (arrow) are indicated by asterisks.

