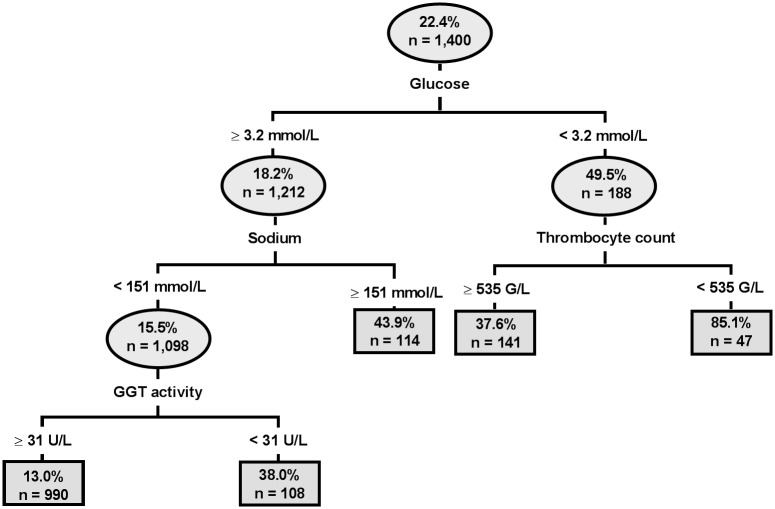
Fig 5. Estimated classification tree identifying significant associations between laboratory variables and observed mortality.
Each oval identifies a subset of the population, the probability of mortality for the subset, and the number of calves in the subset. Lines leaving the oval identify a study variable and its cutpoint value that is a significant predictor of mortality. Branches to the left indicate subgroups with lower mortality (better outcome), whereas branches to the right indicate subgroups with higher mortality (poorer outcome). Classification tree analysis indicated that observed mortality was associated with plasma glucose concentrations < 3.2 mmol/L, plasma sodium concentrations ≥ 151 mmol/L, GGT activity < 31 U/L and a thrombocyte count < 535 G/L in hypoglycemic calves.

