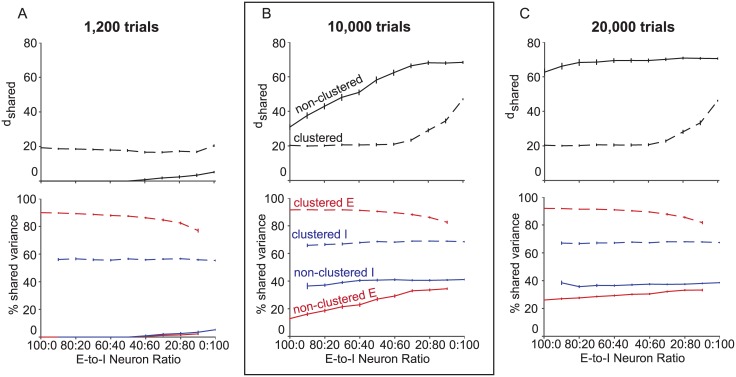
Fig 5. Mixed neuron type samplings.
Population activity structure is dependent on the ratio of excitatory to inhibitory neurons sampled. dshared (top panels) and percent shared variance (bottom panels) averaged across excitatory neurons (red) and inhibitory neurons (blue) for different ratios of excitatory to inhibitory neurons sampled from the clustered (dashed) and non-clustered (solid) networks for 100 neurons and (A) 1,200, (B) 10,000, and (C) 20,000 trials sampled. The left and right ends of the horizontal axes indicate only-excitatory and only-inhibitory samplings, respectively. Panel B is boxed because shared dimensionality and percent shared variance for the 100:0 and 0:100 ratios correspond to values shown in Fig 3 (100 neurons, 10,000 trials).

