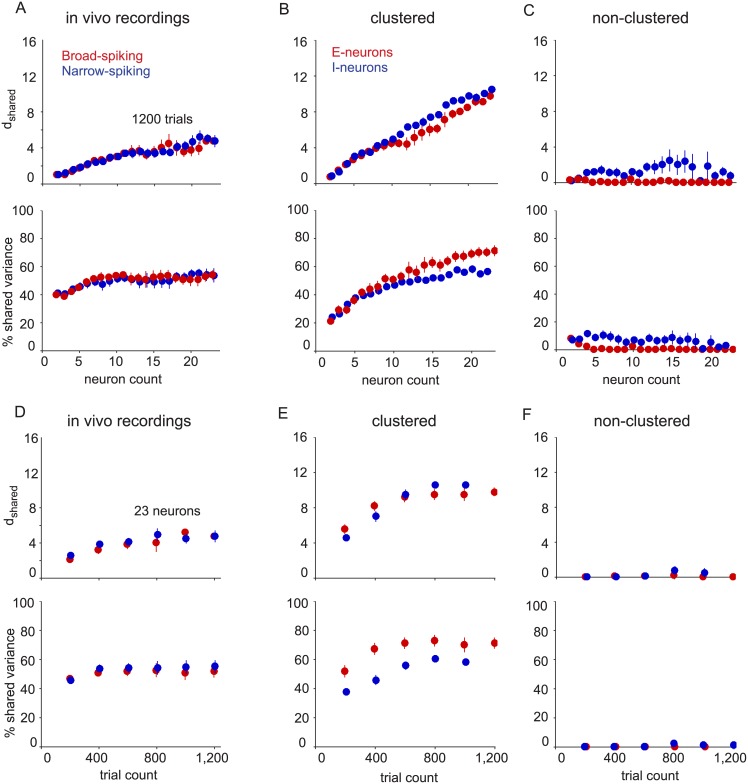
Fig 7. Comparing V1 recordings with network models.
(A) V1 recordings. Shared dimensionality (upper panel) and percent shared variance (lower panel) for broad-spiking (red) and narrow-spiking (blue) neurons. Recorded neurons were separated designated as broad-spiking or narrow-spiking using a mixture of Gaussians classifier on average waveform parameters. (B) Same conventions as in (A), but for the clustered network (left panels) and non-clustered network (right panels) based on 1,200 trials for various neuron counts. Red indicates excitatory neurons and blue indicates inhibitory neurons. (C-D) Same conventions as in A-B, but based on 23 neurons and various trial counts. Error bars indicate standard error taken over four arrays for V1 recordings and four sets of non-overlapping samplings for model networks.

