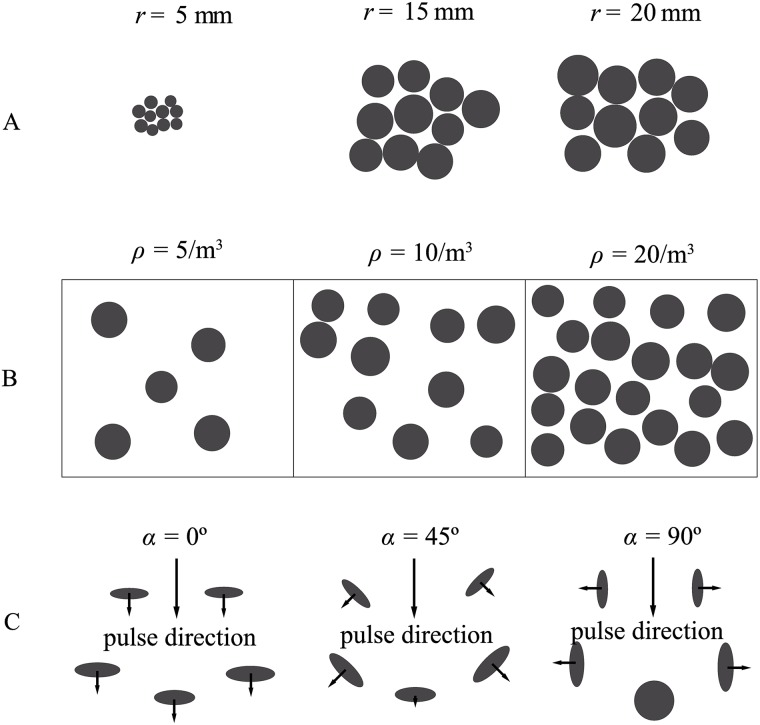
Fig 1. Parameters of the proposed foliage model.
A) Expected value of the leaf radius r. The radii of all leaves are drawn independently from Gaussian distribution with mean r and standard deviation . Ten leaves are shown each for mean radii that equal 5, 15, and 20 mm, respectively. B) Leaf density ρ. Orthogonal projections on the xy-plane of a cubic volume (1 m3) filled with 5, 10, and 20 leaves are shown, respectively. The frame represents the borders of the cubic volume. C) Orientations in a leaf sample around mean orientation angles (α) of 0°, 45°, and 90°, respectively. The orientation angle is defined as the angle between leaf normal and the direction the sonar is aimed in, orientations are drawn from Gaussian distribution with mean α and a fixed standard deviation of 5°.

