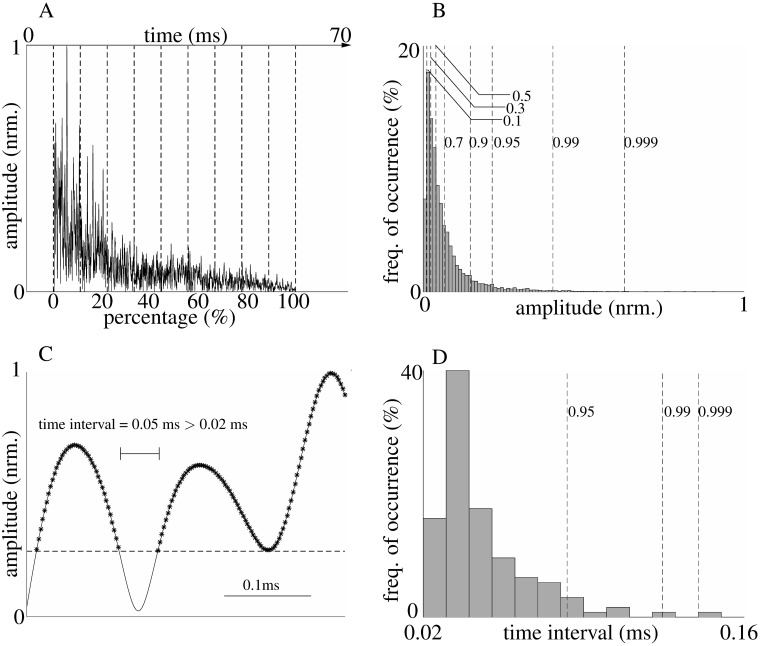
Fig 5. Part of the statistical echo features.
A) Echo envelope evenly divided into 10 time intervals. B) [0.1, 0.3, 0.5, 0.7, 0.9, 0.95, 0.99, 0.999] quantiles of the amplitude above a threshold (one tenth of the maximum value in the last time window, i.e., 90% to 100%). C) Example of a time interval longer than 0.02 ms in zoomed-in view of the envelope. The time intervals are time difference of two adjacent points with values larger than the threshold mentioned above. Find all time intervals and keep the ones longer than 0.02 ms. D) [0.95, 0.99, 0.999] quantiles of the time intervals longer than 0.02 ms. All figure are derived from the same single example echo.

