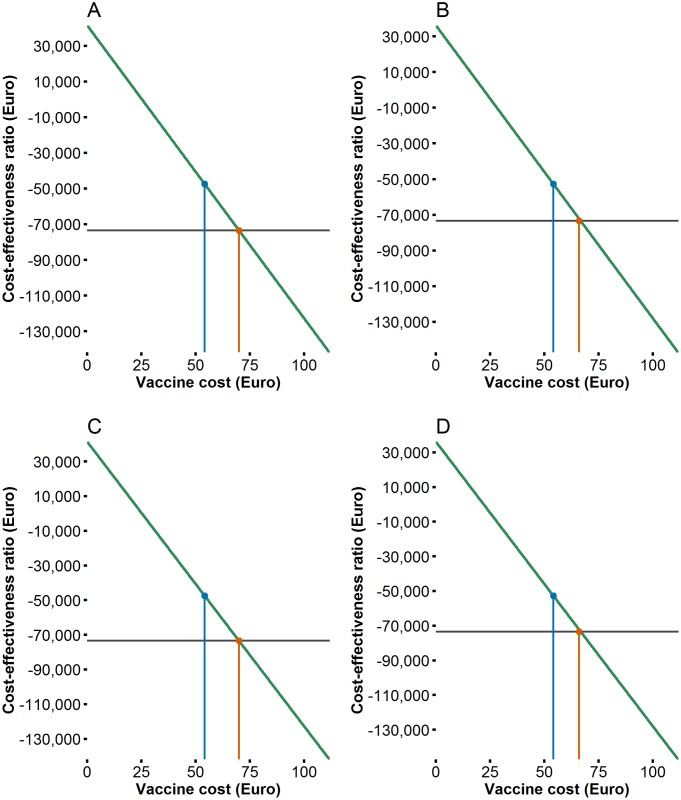
Fig 6. Threshold analysis showing impact of mean vaccine prices per fully vaccinated child on the cost–effectiveness from the healthcare perspective.
(A) Rotarix® 2015–2019. (B) RotaTeq® 2015–2019. (C) Rotarix® 2016–2019. (D) RotaTeq® 2016–2019. The blue line represents the average vaccine prices assumed in the model, and the red line represents the break–even price.

