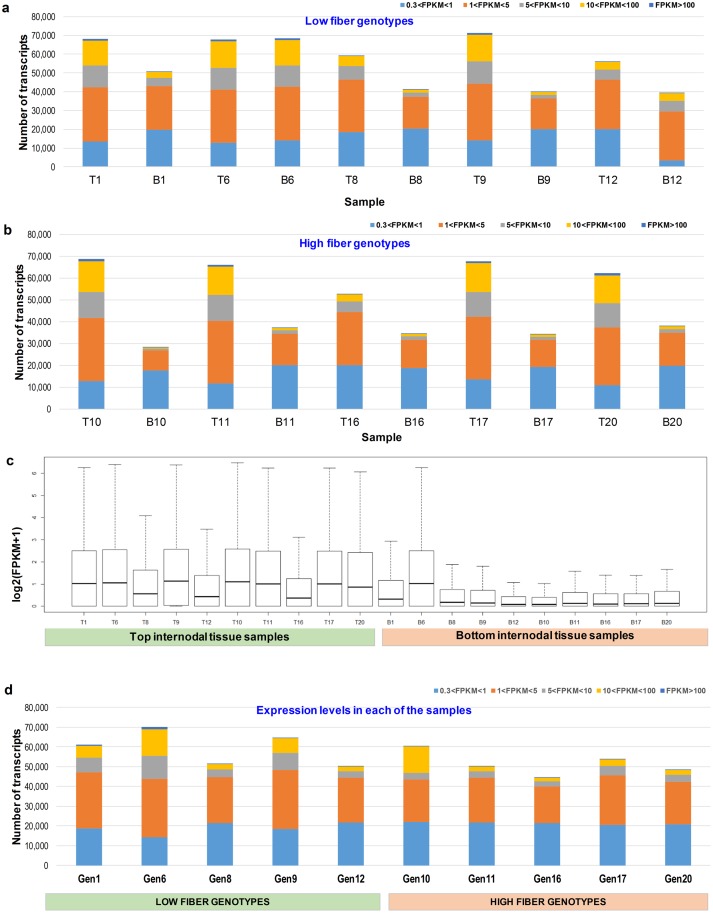
Fig 1. Global expression of samples used in this study.
(a) Transcript expression of top and bottom internodal samples of low fiber genotypes. (b) Transcript expression of top and bottom internodal samples of high fiber genotypes. The x-axis indicates the samples while the y-axis represents the number of transcripts expressed. (c) Boxplot of log2(FPKM+1) distribution amongst the top and bottom internodal samples form low and high fiber genotypes. The x-axis indicates the samples while the y-axis represents the log2(FPKM+1). The transcripts with log2(FPKM+1)>6.5 were not shown here. T denotes the top internode while B denotes the bottom internode. (d) Global expression of 10 pooled genotypes. Gen denotes genotype.

