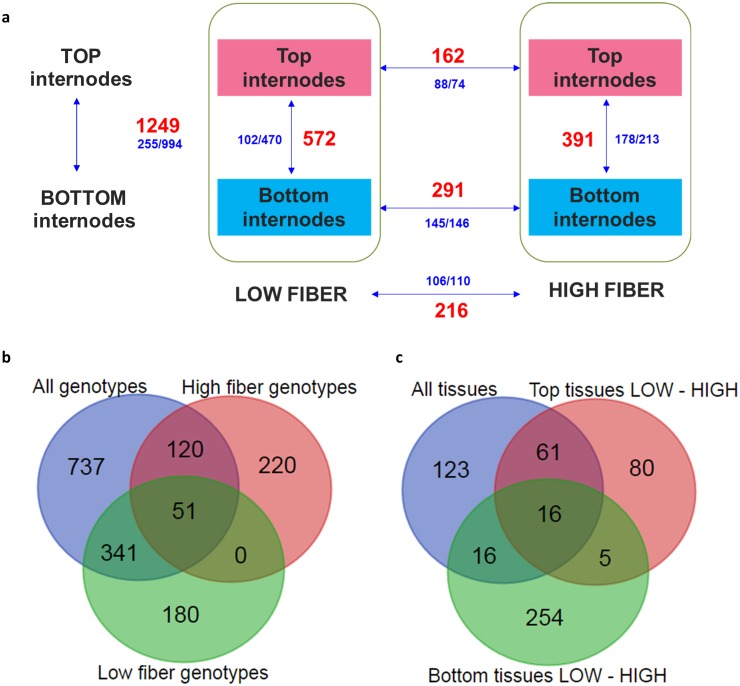
Fig 3. The summary of differentially expressed transcripts.
(a) Differentially expressed transcripts. The red numbers denote the total DE transcripts, while the corresponding blue numbers denote the up-regulated/down-regulated transcripts. (b) Comparison among DE transcripts from all genotypes top vs. bottom tissues, low fiber genotypes top vs. bottom tissues, and high fiber genotypes top vs. bottom tissues. (c) Comparison of DE transcripts from pooled all tissues low vs. high fiber genotypes, bottom tissues low vs. high fiber genotypes, and top tissues low vs. high fiber genotypes.

