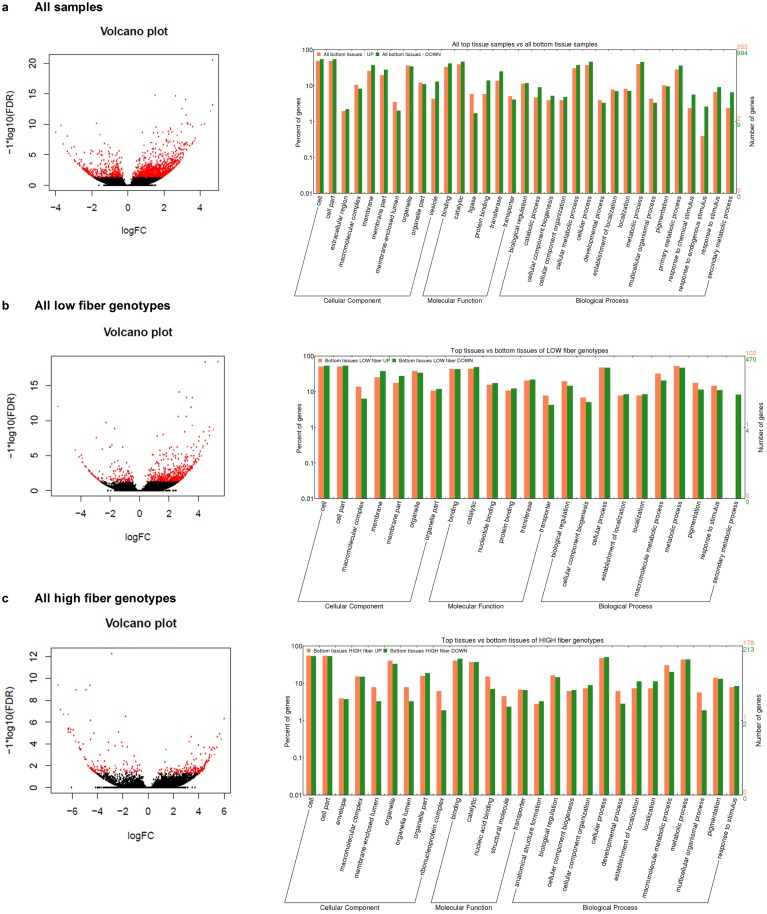
Fig 4. The volcano plots and GO term over-representation analysis between the top and bottom internodal tissues.
(a) All genotypes, (b) Low fiber genotypes and (c) High fiber genotypes. In the left panel, the red dots denote the significant DE transcripts at FDR adjusted p-value <0.05, while the black dots denote the non-significant transcripts between the two cases. In the bar chart (right panel), the right y-axis indicates the number of transcripts for each GO term, while the left y-axis indicates the percentage of transcripts in each GO main category.

