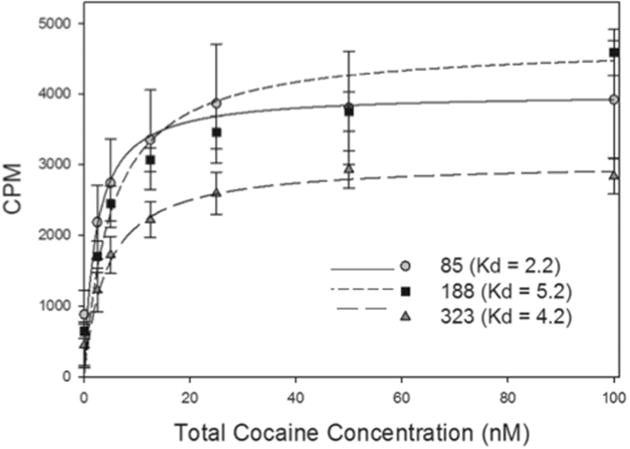
Fig. 1.

[3H]Cocaine binding curves for h2E2 mAb from the three clones. The y-axis represents specific counts per minute. The x-axis represents total cocaine concentration (nM). Each point represents the mean ± SEM from n=3 for 85 and 323, and n = 4 for 188. The curves represent the mean fit from all replicates for each clone.
