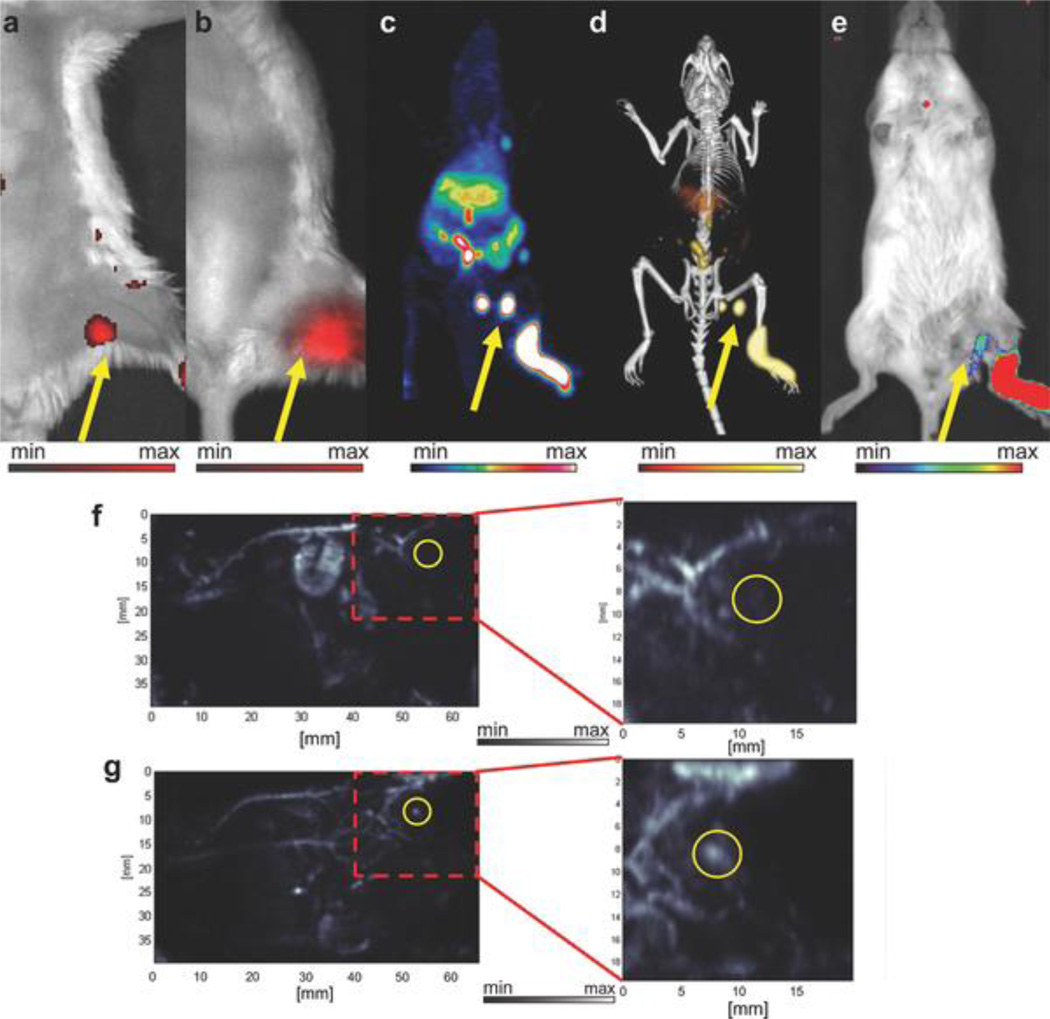
Figure 10.
In vivo lymphatic imaging using porphyrin-phospholipid (PoP)-UCNPs. Accumulation of PoP-UCNPs in the first draining lymph node is indicated with yellow arrows. a) Fluorescence and b) upconversion images with the injection site cropped out of frame. c) Full body PET, d) merged PET/CT, and e) Cerenkov luminescence images. f) Photoacoustic images before and g) after injection show endogenous PA blood signal compared to the contrast enhancement that allowed visualization of the previously undetected lymph node. Reproduced with permission.[195] Copyright 2015, Wiley.

