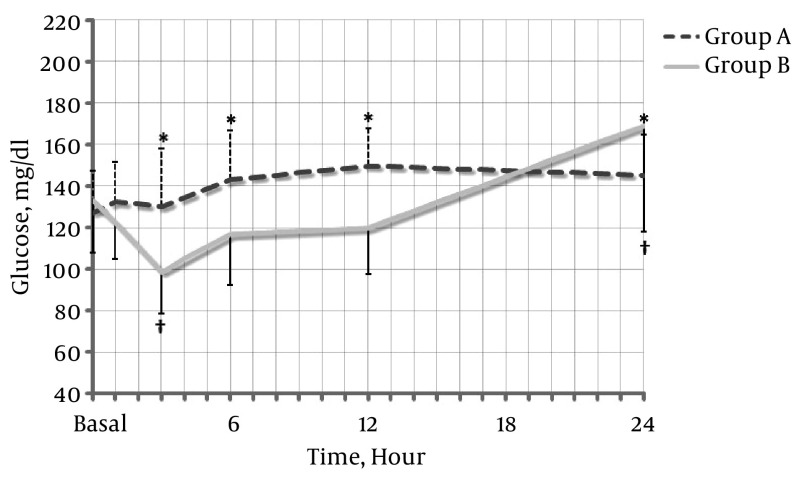
Figure 2. Perioperative Changes to Blood Glucose Levels Following an Intravenous Infusion of Dexmedetomidine or Saline.
Group A (black dotted line): dexmedetomidine administration; Group B (gray line): saline administration. The data are presented as the mean ± standard deviation. *P ≤ 0.050 versus group B. †P ≤ 0.050 versus the baseline within the group.

