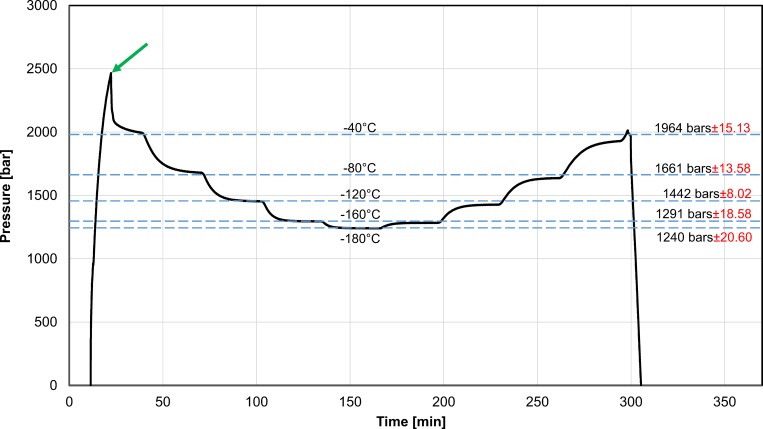
Fig 4. Pressure as a function of time during cooling and warming.
The experiments were performed by setting a constant temperature for periods of 30 minutes during cooling and warming. The constant temperatures and their corresponding steady state pressure (with the standard deviation) measured are listed on the figure. The arrow points to the spike in pressure during cooling to– 40°C. Supporting information contained in S2 File

