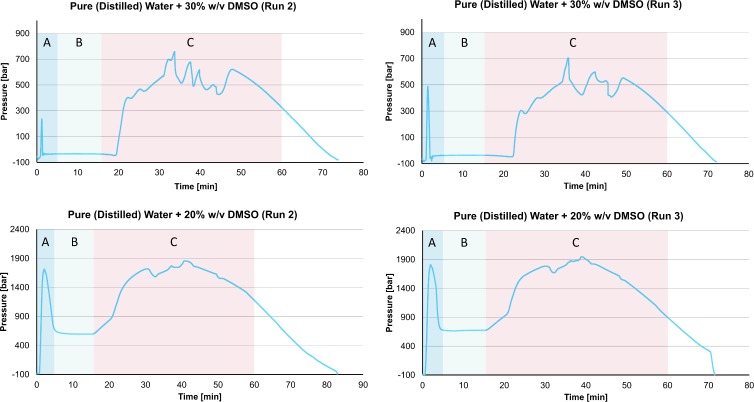
Fig 8. Pressure as a function of time during the freezing and thawing of various solutions of water and Me2SO to and from liquid nitrogen temperatures.
The temperature history is given in the Fig 6 and the three regions (A, B, and C) correspond to those marked in Fig 6. Supporting information contained in S5 File

