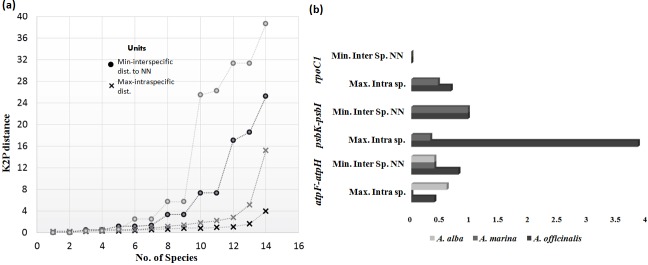
Fig 2. Genetic distance.
Distribution of intra and inter specific K2P mean divergence (arranged in ascending order). (a) ITS2 and ITS2+matK (concatenated) are represented by grey and black colors respectively. (b) For atpF-atpH, psbK-psbI and rpoC1 markers maximum intraspecific distance and minimum interspecific distance to nearest neighbor are represented by a bar.

