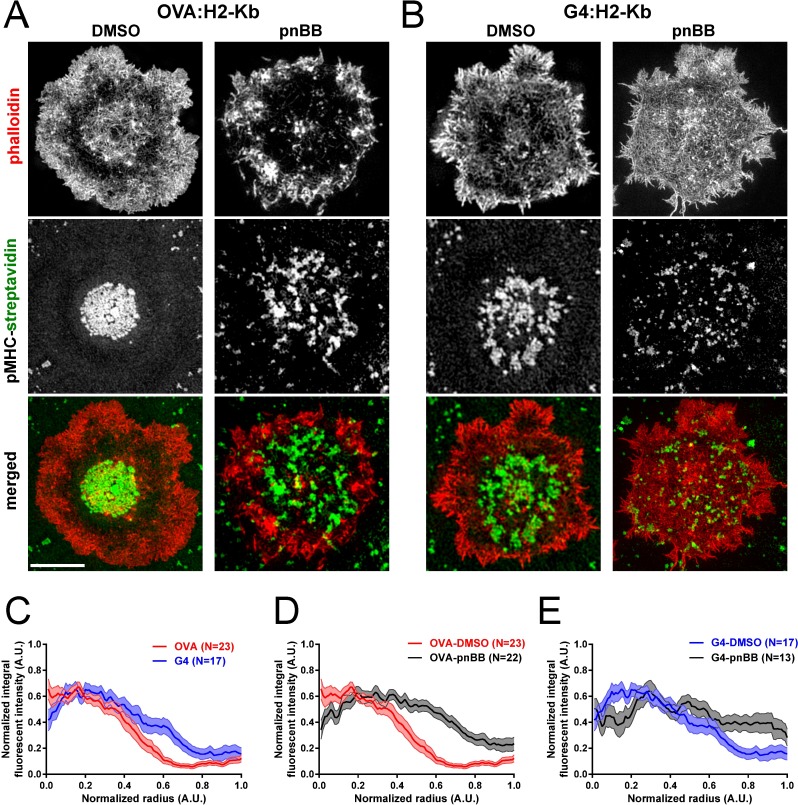
Fig 4. Actomyosin arcs facilitate the accumulation of TCR MCs at the IS center in a ligand-dependent and contractility-dependent manner.
(A and B) Representative 3D-SIM images of OT1 T cells that had been pretreated with either DMSO or pnBB in DMSO, allowed to attach for 7 min to planar lipid bilayers containing ICAM-1 and either OVA:H-2Kb (A) or G4:H-2Kb (B) bound via fluorescent SA (to indirectly report the position of TCR MCs in the T cell), and then fixed and stained with phalloidin (red). The distribution of SA (green) and the merged images are shown in the middle and bottom rows, respectively. Scale bar, 5 μm. (C) Averaged, normalized radial integral intensity profiles of fluorescent SA in bilayers containing OVA:H-2Kb (red) or G4:H-2Kb (blue) (p <0.001). (D) Averaged, normalized radial integral intensity profiles of fluorescent SA in bilayers containing OVA:H-2Kb using OT1 T cells pretreated with either DMSO (red) or pnBB in DMSO (black) (p < 0.0001). (E) Averaged, normalized radial integral intensity profiles of fluorescent SA in bilayers containing G4:H-2Kb using OT1 T cells pretreated with either DMSO (blue) or pnBB in DMSO (black) (p < 0.0001). For (C), (D) and (E), the mean value is represented by the bold line, while the SEM is represented by the surrounding shaded area.

