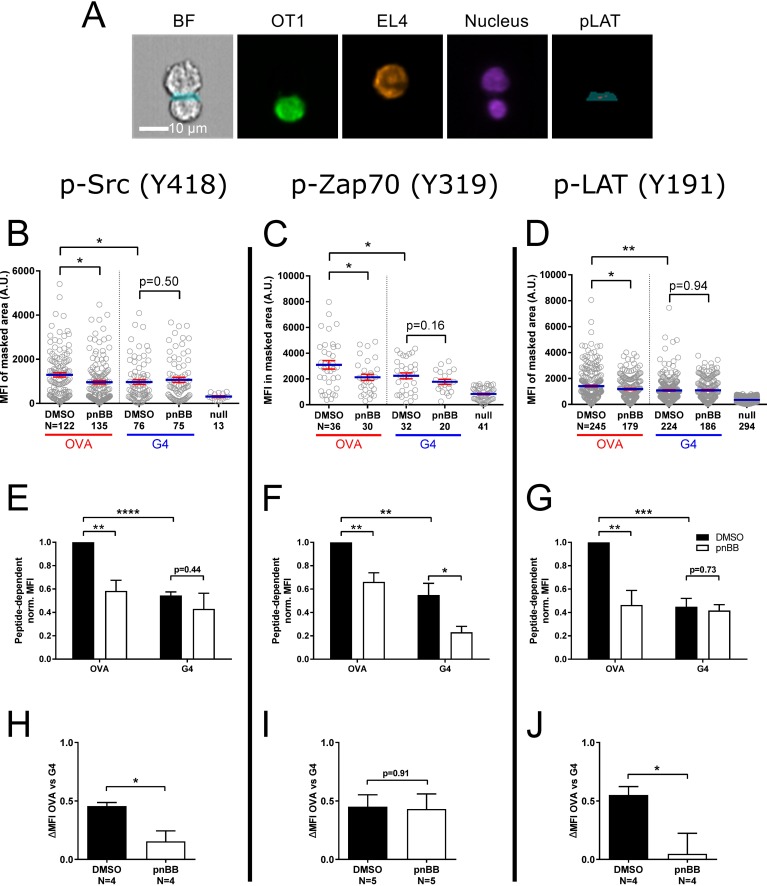
Fig 5. Myosin 2 facilitates proximal TCR signaling in a ligand-dependent manner.
(A) Representative example of AMNIS Imagestream images used to quantitate signaling molecule phosphorylation at the IS of OT1 T cells conjugated with EL4 target cells by employing a combination masking strategy (see Methods for details). Shown from left to right are the bright-field (BF) image with the portion of the combination mask that corresponds to the IS (blue), the signal for GFP-F-Tractin (green) in the OT1 T cell, the signal for farnesylated RFP (pseudocolored orange) in the EL4 target cell, the signals for the nucleus (purple) in both cells, and the portion of the combination mask that corresponds to the IS (blue) overlaid with the signal for pLAT at the IS (red). Scale bar, 10 μm. (B, C, and D) MFIs for pSrc (B), pZap70 (C), and pLAT (D) at the IS of OT1 T cells that had been pretreated with either DMSO or pnBB in DMSO and allowed to form conjugates for 10 min with EL4 target cells loaded with either OVA:H-2Kb or G4:H-2Kb prior to fixation and staining. Each circle represents a single OT1: EL4 conjugate. (E, F, G) Normalized MFIs from three or more experiments performed exactly as in (B), (C) and (D), except that these normalized MFIs were background corrected by subtracting the MFI for the null peptide control. (H, I, and J) Shown are the differences in mean MFI values presented in (H), (I) and (J) between OVA:H-2Kb-engaged and G4:H-2Kb-engaged T cells. The value obtained, referred to as “ΔMFI OVA vs G4” on the y axis, represents a measure of the contribution made by myosin 2 contractility to ligand discrimination. Mean ± SEM (N ≥ 3). *, **, *** indicate p < 0.05, 0.01, 0.001.

