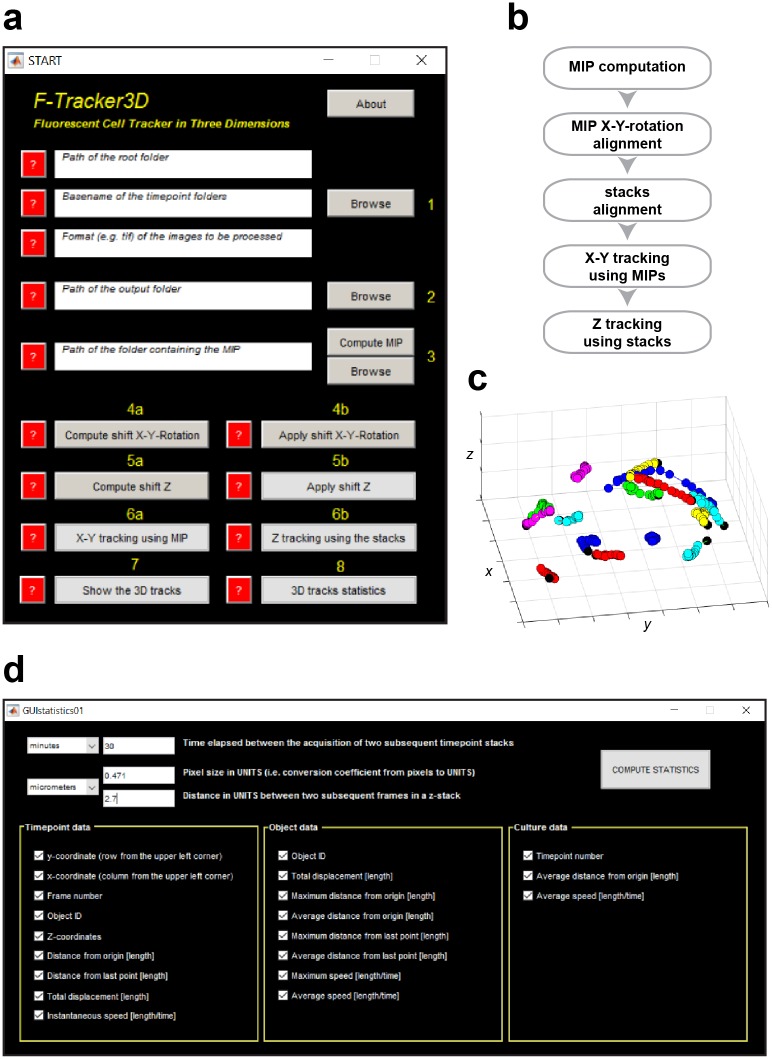
Fig 1. F-Tracker3D, an open source software tool for tracking cells in 3D.
(A) F-Tracker3D GUI. (B) The F-Tracker3D flow chart: first of all, for each z-stack the MIP is computed along the z-dimension. The input stacks of fluorescence images are then rotated and aligned in (x, y, z) for setting a global absolute reference frame. MIPs are used to track the single cells in 2D. Finally, for each z-stack and (x, y) position, the z coordinate is estimated by selecting the z-plane containing the maximum intensity value. (C) Visualization of the 3D tracks. (D) A number of quantitative tracking measures can be automatically computed and exported as Microsoft Excel work sheet, MATLAB and csv files.

