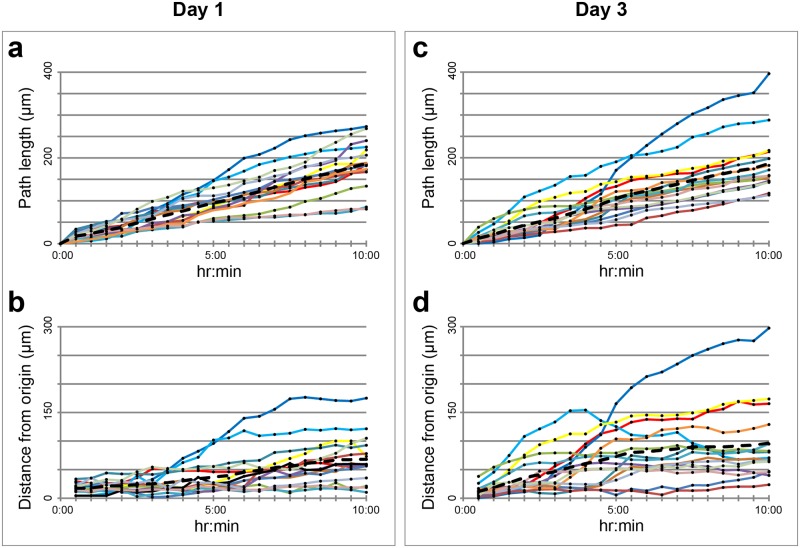
Fig 4. Large scale F-Tracker3D analysis on15 MSCs loaded onto fibroin-alginate microcarriers.
The graphs show path length (A, C) and distance from the origin (B, D), computed considering populations of randomly selected cells (n = 15) at day 1 (A, B) and day 3 (C, D) from initial loading into microcarriers. Note: in the graphs the curves referring to the single cells are reported in different colours. The black dotted line represents the average value in each time point.

