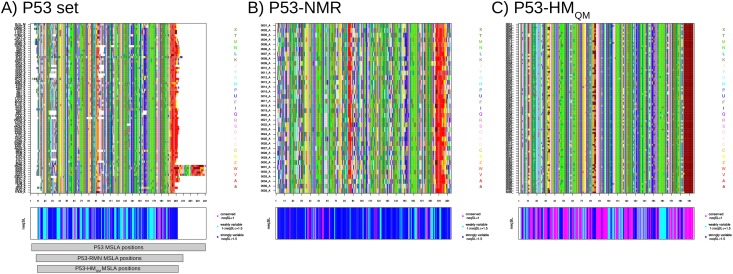
Fig 7. Visualization of the structural variability of three subsets associated with the p53 DBD: For the P53 (A), P53-NMR (B), and P53-HMQM (C) sets.
The upper figures correspond to the MSLA maps computed for each subset. The aligned SL sequences are shown in rows and the aligned positions (in columns) are colored according to the 27 SLs. The colors of the SLs indicate the associated secondary structure: [a, A, V, W]-SLs in red are primarily found in the α-helix, [L, M, N, T, X]-SLs in green are primarily found in the β-strand, other SLs correspond to loop. The bottom figures present structural conservation/variability of each subset position in terms of neqSL. Positions are colored according to their neqSL values. Structurally conserved positions, i.e., positions exhibiting a neqSL value of 1, are colored in magenta. Structurally weakly variable positions, i.e., positions exhibiting a neqSL value included from 1 to 1.5, are colored in cyan. Structurally strongly variable positions, i.e., positions exhibiting a neqSL value larger than 1.5, are colored in blue. The alignment of positions of the three sets is presented below graphs of (A).

