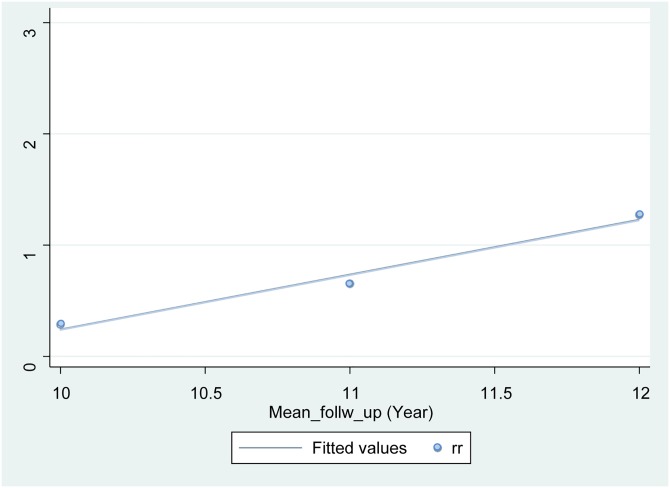
Fig 3. Simple linear regression.
Risk ratio (y-axis) was plotted as a function of the mean follow-up period in the interventional and control groups of each study (x-axis), and a simple linear regression line was fitted using the least squares method. The point at which the risk of cancer occurrence in the interventional group exceeds that in the control group was calculated to be approximately 11.5 years. rr, risk ratio.

