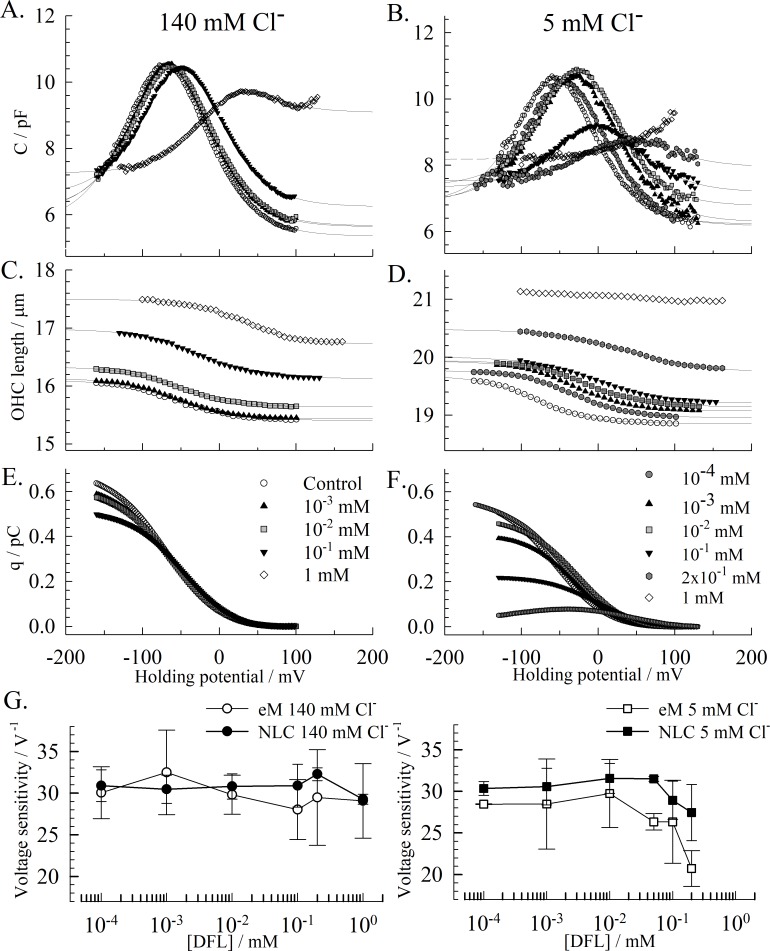
Fig 2. Effect of DFL on OHCs.
The curves in A, C, E and in B, D F respectively are recorded on the same cells and in the same conditions, during hyperpolarizing voltage ramps. (A) & (B) Representative NLCs recorded on 2 different OHCs respectively with 140 mM and 5 mM chloride intracellularly. Increasing concentrations of DFL are perfused in the chamber, from 10−4 mM to 1 mM. The fits of the two-state CSA model equation to the NLCs are shown as solid lines. In the absence of drug, the average parameters are: Clin = 5.70±0.67 pF; Cmax = 9.54±1.01 pF; Qmax = 0.47±0.07 pC; V1/2 = -42.4±12.9 mV; z = 0.84±0.4. (C) & (D) Cell length recorded concomitantly in μm. The solid lines are the resulting fits of the data to the two-state CSA model equation (Eq 2). In the absence of drug, the average characteristics of eM are L0 = 18±2.4 μm; Lmax = 0.60±0.15 μm; V1/2 = -38.90±15.31 mV; α = -31.55±3.99 V-1. (E) & (F) Charge transfer against voltage, obtained from Q = Σ(ΔV.C). (G) The voltage sensitivity (α = ze/kT) for charge transfer and eM is determined at peak voltage and plotted against the DFL concentration. Each data point represents the average value from recordings on 3 cells or more, and the error bars are the standard deviation.

