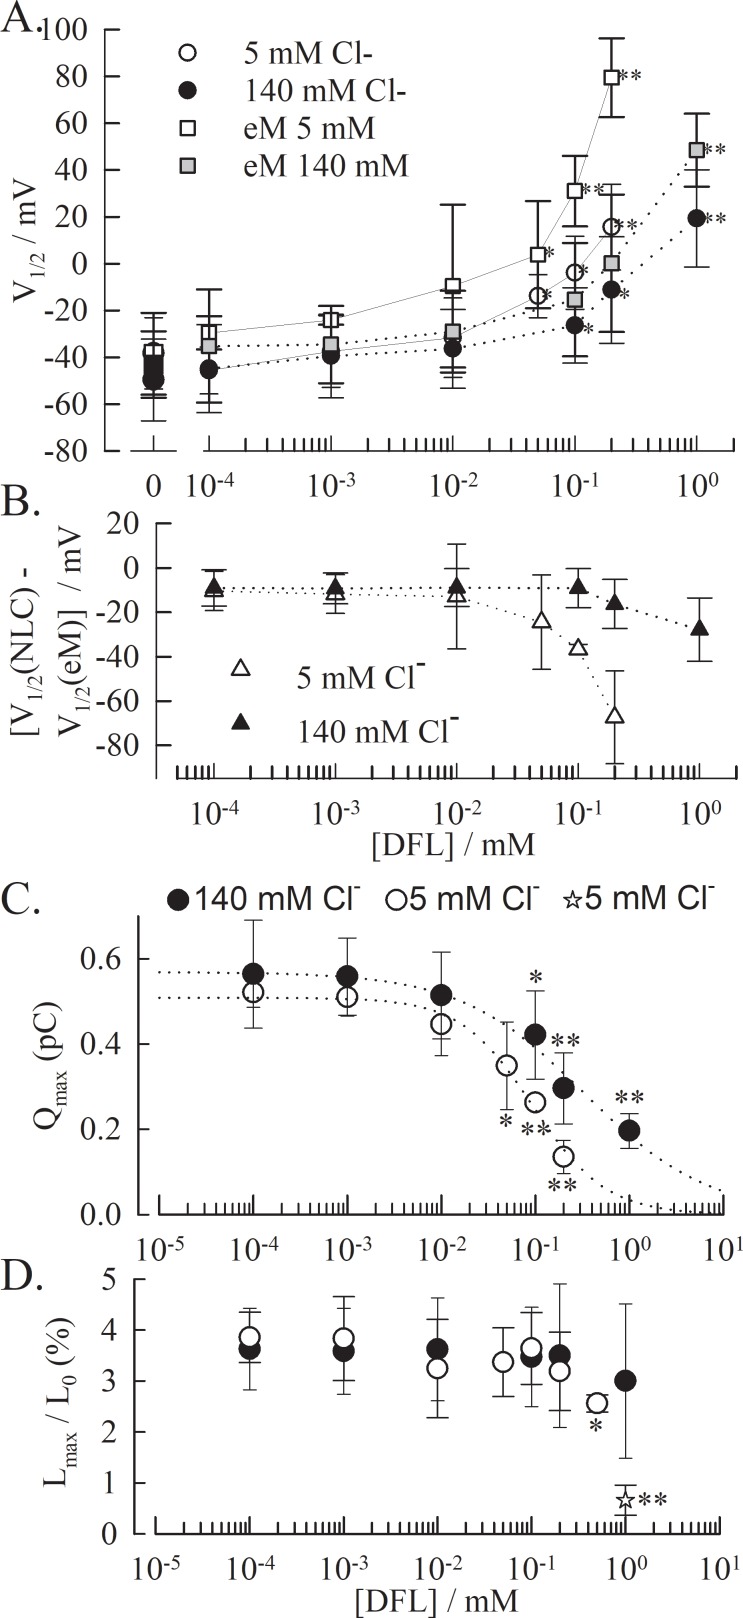
Fig 3. NLC and eM in the presence of DFL and in different chloride conditions.
(A) V1/2 value obtained with OHCs from two-state Boltzmann fits of the NLC (○ at low & ● at high intracellular chloride) and the eM (◻ at low & at high intracellular chloride), plotted against DFL concentration. (B) The difference V1/2(NLC)—V1/2(eM) shows decoupling between charge transfer and electromotility as [DFL] increases. The t-test is conducted between the values obtained without DFL versus with DFL * p<0.01; ** p<0.001. (C) Inhibition of the NLC and (D) of the eM by DFL. The dotted line is the resulting fit of the data by a Hill equation (140mM Cl: nH = -0.66, IC50 = 331 μM; 5mM Cl-: nH = -1.12, IC50 = 98 μM), The resulting eM is only inhibited at concentrations above 0.5 mM in low chloride conditions. The value for eM at 1mM DFL at low chloride concentration was obtained from direct measurement of cell length at hyperpolarized and depolarized voltages (star). For all plots, the data points represent the average and the error bar is the standard deviation for n≥3 cells per condition.

