
Fig 2. Lipid parameters in the serum and liver of rats (n = 8–10 per group).
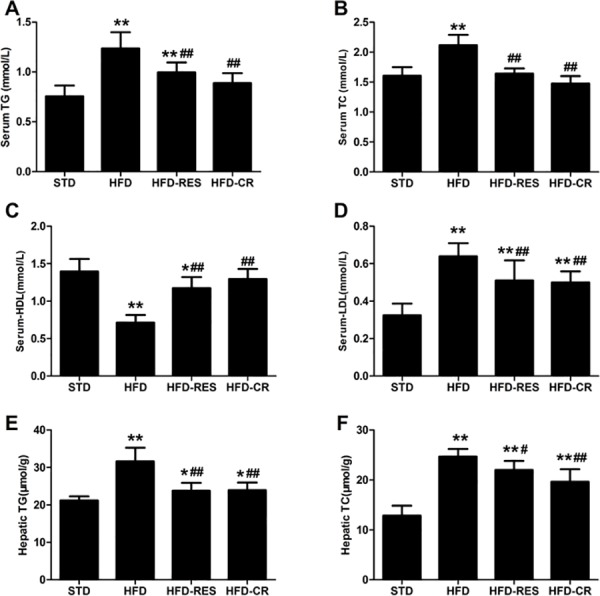
(A) Serum total triglycerides. (B) Serum total cholesterol. (C) Serum HDL. (D) Serum LDL. (E) Hepatic total triglycerides. (F) Hepatic total cholesterol. *, P<0.05 and **, P<0.01 compared with the STD group; #, P<0.05 and ##, P<0.01 compared with the HFD group. Data are expressed as the mean ± SD.