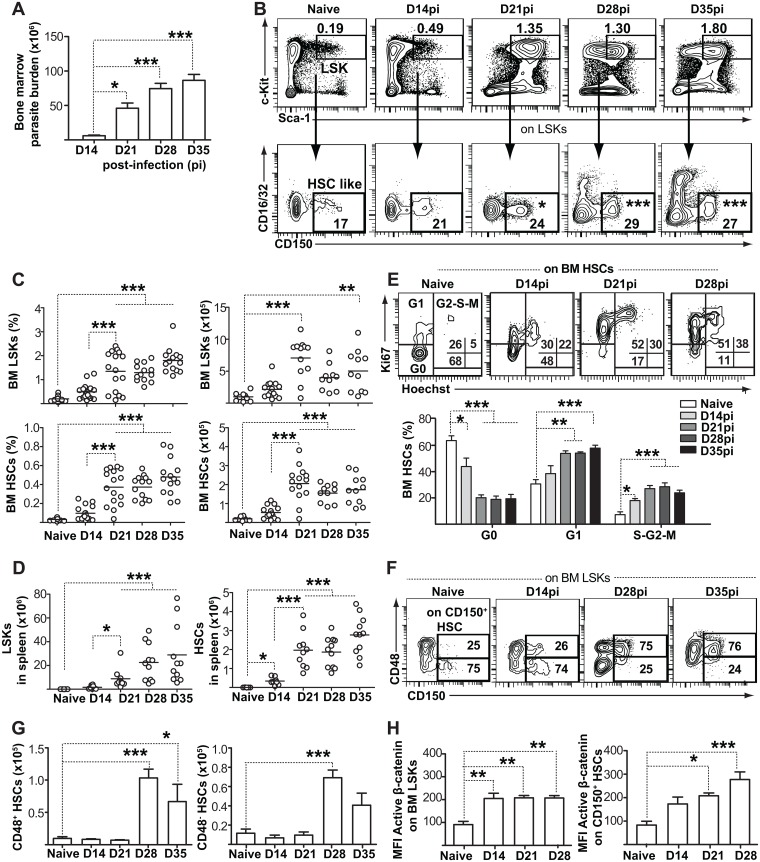
Fig 1. Parasite expansion coincides with proliferation and accumulation of bone marrow hematopoietic stem/progenitor cells (HSPC).
(A) Bone marrow parasite burden was assessed using the serial limiting dilution technique. Graph shows parasite burden per one femur and one tibia. (B) Representative flow cytometry data and gating strategy of BM HSPCs. BM cells were first gated on Lin- (B220-CD3ε-CD11b-GR1-Ter119-) and identified according to Sca1 and cKit (CD117) expression. HSCs were defined as CD150+ CD16/CD32- within the Lin-cKithi Sca1+ (LSK) population. Numbers within flow cytometry plots represent mean LSK percentage within total bone marrow and mean HSC percentage within LSKs. See also S1 Fig. (C) Histograms show percentage and absolute numbers of LSKs and HSCs per two femora and two tibiae. Data are pooled from three independent experiments, with each individual dot representing one mouse. Horizontal lines represent the sample mean. (D) Absolute numbers of LSKs and CD150+ HSCs in spleens of infected mice. See also S1 Fig. (E) Ki-67/Hoechst co-staining was used to distinguish the G0, G1, and S/G2/M cell cycle phases of CD150+ HSC-like cells during infection. (F) Analysis of CD48 expression within BM CD150+ HSC-like cells. Numbers within flow cytometry plots represent CD48+ and CD48- HSC subsets within CD150+ HSC like cells. (G) Graphs depict the numbers of cells for the two subsets at various time points after infection. (H) Intracellular active β-catenin levels (MFI) within CD150+ HSC-like cells. See also S1 Fig. All bar graphs represent mean + SEM with 4 mice per group coming from one single infection. Similar results were obtained in two additional independent experiments. *P<0.05; **P<0.01; ***P<0.001.

