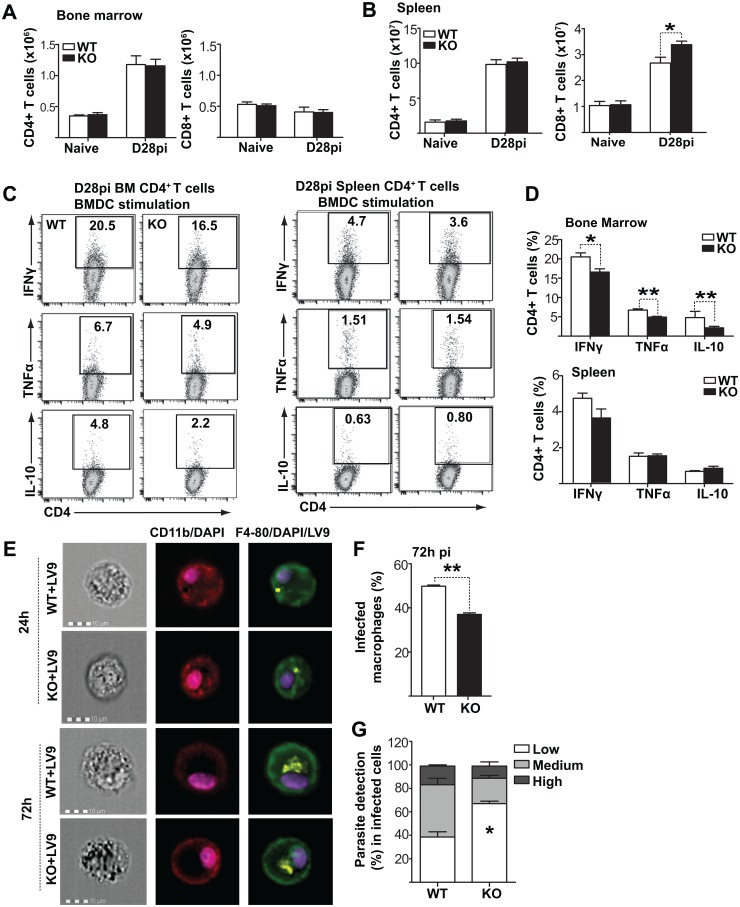
Fig 7. Fzd6-/- T lymphocytes are functionally indistinguishable from their Fzd6+/+ counterparts.
(A-B) Numbers of CD4+ and CD8+ T cells in BM (A) and spleen (B) of naïve and infected mice on day 28. (C-D) Cytokine production by bone marrow and spleen CD4+ T cells isolated from infected mice and stimulated ex vivo with parasite-pulsed bone marrow dendritic cells. Representative flow cytometry data are shown in (C). Graph in (D) shows compiled results from a representative experiment. See also S10 Fig. All bar graphs represent mean + SEM with 7 mice per group for day 28. (E) Macrophages derived from naïve Fzd6-/- (KO) and Fzd6+/+ (WT) bone marrow were either left untreated, stimulated with IFN-γ alone or first primed with IFN-γ and then infected with PKH26-labeled L. donovani amastigotes. See also S10 Fig. Imaging flow cytometry analysis of macrophages infected with fluorescent Leishmania parasites, showing multiple parasites within both Fzd6-/- (KO) and Fzd6+/+ (WT) macrophages. (F) Histograms represent percentage of infected macrophages and (G) parasite numbers in infected macrophages 72h post-infection. Low = 1–3, medium = 4–10, high = >10 parasites / cell. Bar graphs represent mean + SEM from two independent experiments.

