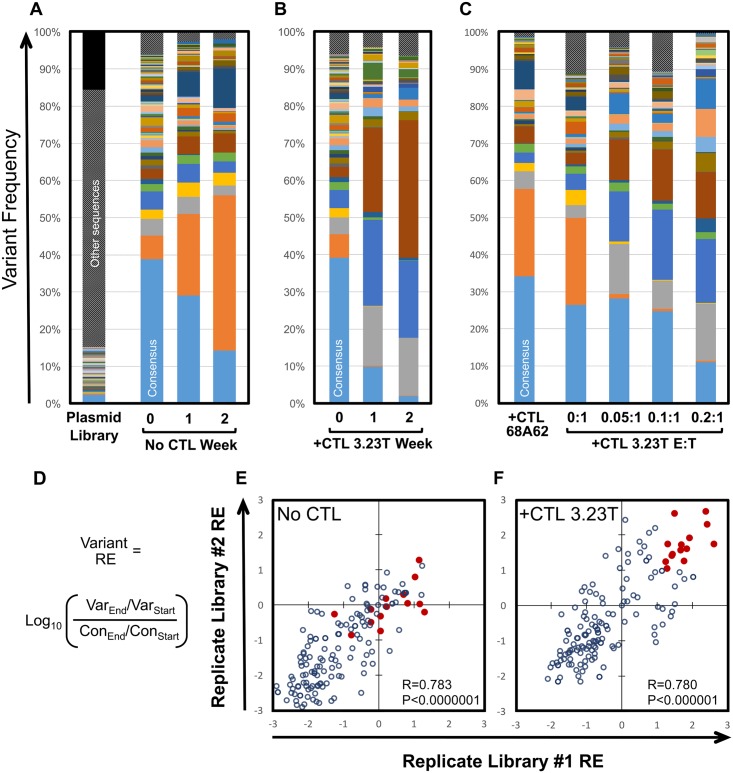
Fig 2. CTL selective pressure results in altered HIV-1 epitope variant frequencies.
A. The frequencies of each SL9 epitope variant are plotted for the plasmid library, initial virus library, and virus populations after one or two weeks of passage (in the absence of CTL selection). All sequences below a frequency threshold of 2.5x10⁻⁵ in the plasmid library (inadequately represented for carry-through to the virus library) are represented in black. The frequencies of the consensus variant are significantly different between time points (p<0.00001). The subtype B consensus variant of the SL9 epitope is indicated by the bottom light blue bars in all bar graphs, and color coding of each variant is consistent across panels; variants not achieving the frequency cutoff of 1x10⁻⁴ in both replicates of the starting virus library are labeled “other sequences” and indicated by hatched gray bars. B. The frequencies of epitope variants after one and two weeks of passaging in the presence of the SL9-specific CTL clone 3.23T are indicated. Again, the consensus variant differs significantly between time points (p<0.00001), and additionally significantly different (p<0.00001) between libraries cultured without versus with 3.23T after 1 and 2 weeks. C. Epitope variant frequencies are plotted after one week of passaging in the presence of a control CTL clone 68A62 recognizing an A*02-restricted epitope in reverse transcriptase, or different effector to target (E:T) ratios of clone 3.23T. The frequencies of the consensus variant are significantly different (p<0.00001) between culture with 68A62 versus 3.23T. D. The formula to calculate relative enrichment (RE) of each variant compared to the subtype B consensus epitope variant using the frequency of each variant compared to the consensus epitope is shown. E and F. The REs between two biological replicate experiments with the SL9 variant library passaged in the absence (E) or presence (F) of clone 3.23T (RE-CTL values without CTLs and RE+CTL values with CTLs respectively) are plotted. Red dots in both panels E and F indicate variants with high RE+CTL values, demonstrating their locations in the RE-CTL plot. All panels are representative of individual replicate experiments.

