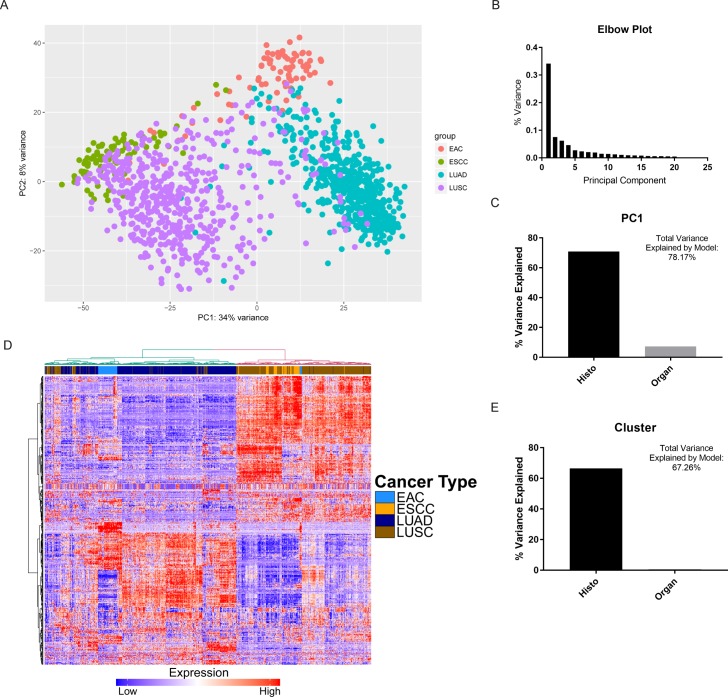
Fig 1. Histology explains a greater degree of gene expression variation than organ site.
(A) Principal Component Analysis (PCA) plot depicting two largest components of variance in gene expression in four cancer types. (B) Elbow plot showing the proportion of variance explained by the first 20 principal components (PC1 explains 0.34 or 34% of total variance). (C) Bar chart depicting relative importance (percent variance explained) by histology and organ site, respectively, based on a multiple linear regression model with PC1 as the response variable. Regression model created was [PC1 = 47.2 × Histo + 21.66 × Organ − 42.85], where explanatory variables were demarcated as Histo (0 = SCC, 1 = ADC) and Organ (0 = Esophagus, 1 = Lung). (D) Heatmap of differentially expressed genes between esophageal cancers and lung cancers, with hierarchical clustering. (E) Bar chart depicting relative importance (percent variance explained) by histology and organ site, respectively, based on a multiple linear regression model with Cluster number (1 or 2) as the response variable. Regression model created was [Cluster = 0.80 × Histo + 0.12 × Organ + 1.01], where explanatory variables were demarcated as Histo (0 = ADC, 1 = SCC) and Organ (0 = Lung, 1 = Esophagus).

