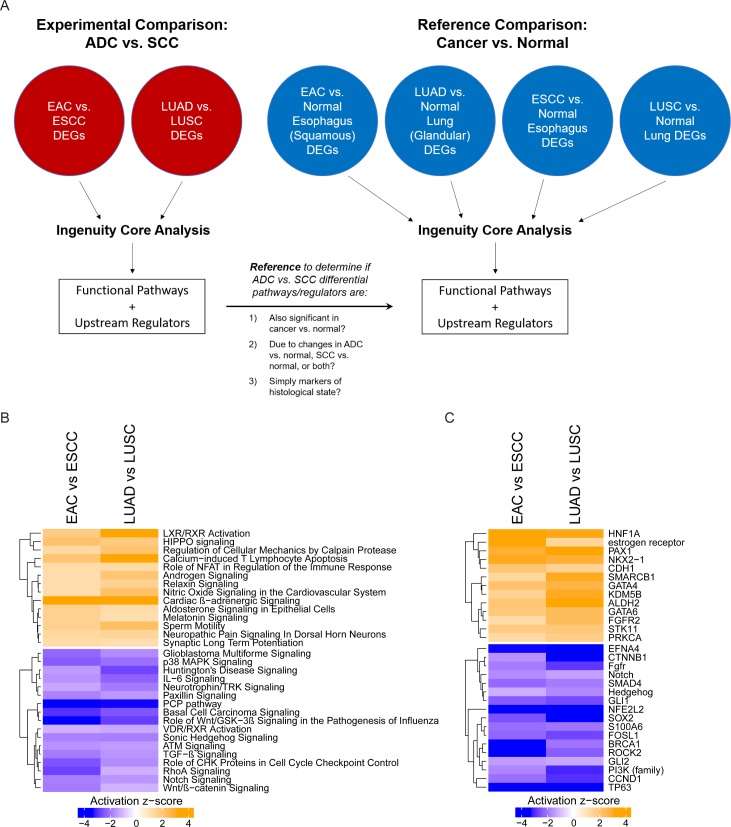
Fig 5. Pathway and upstream regulator analysis using DEGs between ADC and SCC.
(A) Schematic illustrating workflow from differential gene expression analysis to pathway and upstream regulator analysis, along with use of reference comparisons (cancer vs. normal). (B) Putative functional pathways that may play a role in the development of ADC and SCC, by activation z-score. (C) Potential upstream regulators with a functional impact on ADC versus SCC, by activation z-score.

