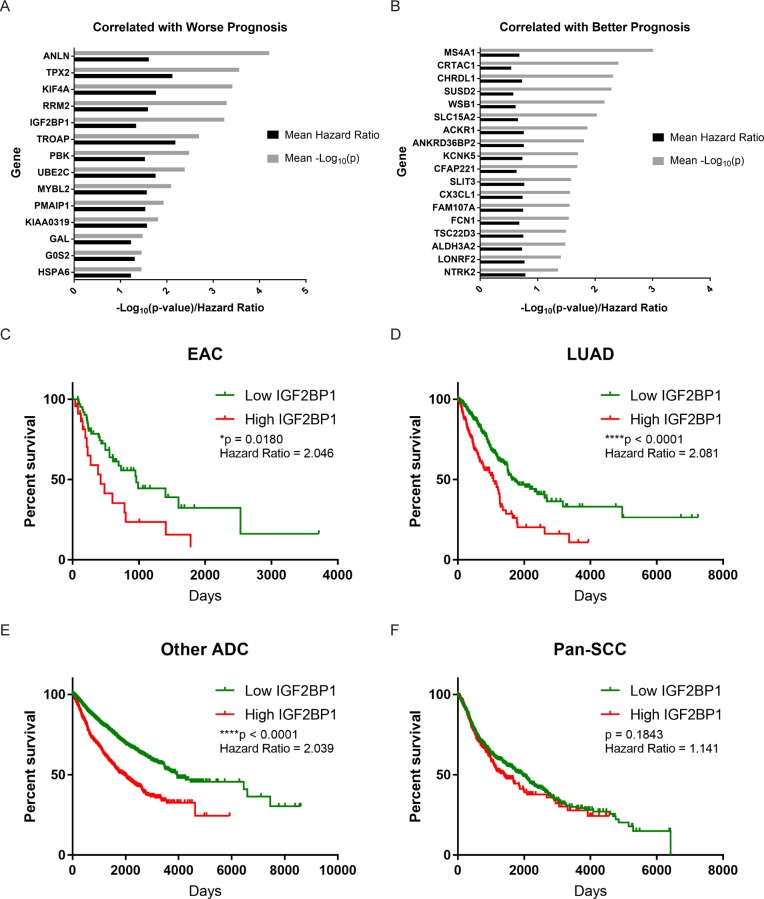
Fig 6. Genes correlated with survival in ADCs.
(A) Genes whose expression is correlated with worse survival in ADCs. (B) Genes whose expression is correlated with better survival in ADCs. (C) Kaplan-Meier curve depicting survival in high IGF2BP1 and low IGF2BP1 expression groups in EAC (log-rank test). (D) Kaplan-Meier curve depicting survival in high IGF2BP1 and low IGF2BP1 expression groups in LUAD (log-rank test). (E) Kaplan-Meier curve depicting survival in high IGF2BP1 and low IGF2BP1 expression groups in pooled ADCs, excluding EAC and LUAD (log-rank test). (F) Kaplan-Meier curve depicting survival in high IGF2BP1 and low IGF2BP1 expression groups in pooled SCCs (including ESCC and LUSC) (log-rank test).

