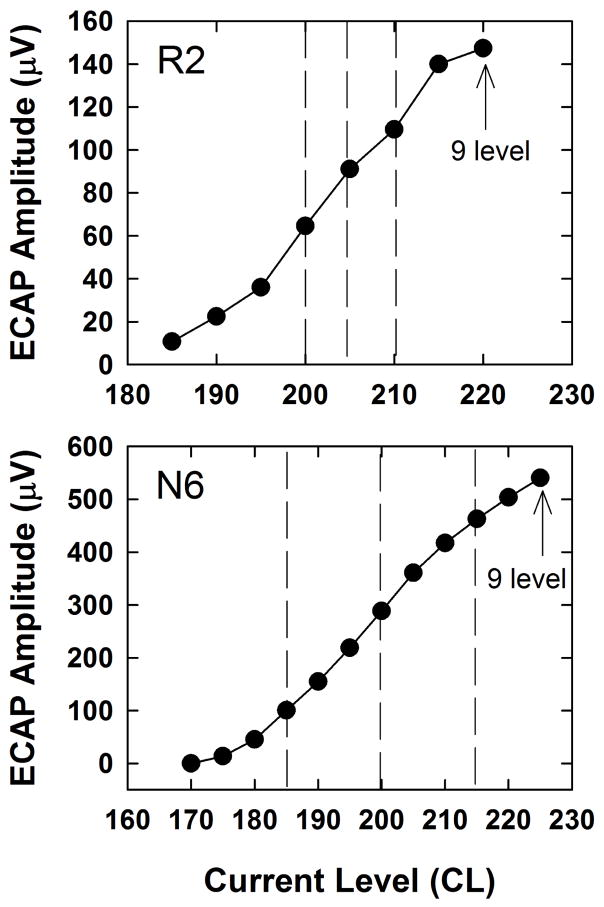
Fig. 1.
Representative ECAP amplitude growth functions obtained using the standard two-pulse forward-masking subtraction paradigm. Data are shown for two subjects; subject number is indicated in each panel. The vertical dashed lines represent the three stimulus levels (low, medium, and high) used for the main experiment.

