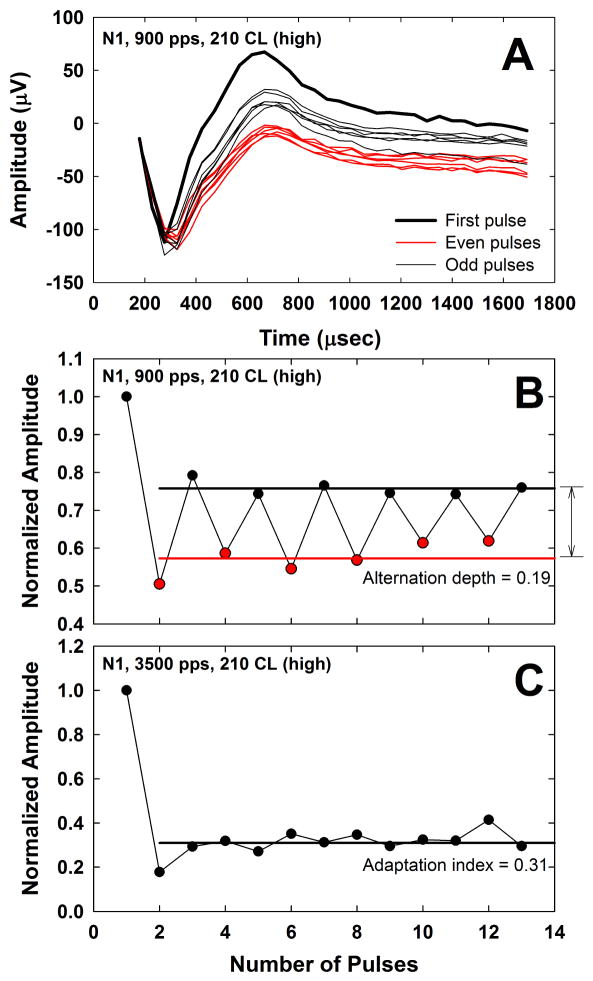
Fig. 3.
A: ECAP waveforms for pulses 1–13 after artifact-reduction methods from Fig. 2 are applied. Data are from subject N1 for a 900-pps pulse train at the highest level (210 CL). The ECAP response to the first pulse (indicated by the thick solid line) has the largest amplitude. ECAPs obtained in response to even- and odd-numbered pulses are shown with thin red or black lines, respectively. Note that responses to the even-numbered pulses are generally the smallest. B: Peak-to-peak ECAP amplitudes from Fig. 3A normalized to that of the first pulse in the train. Data for even- and odd-numbered pulses are shown with red and black symbols, respectively. Red and black horizontal lines indicate the mean normalized amplitudes for even- and odd-numbered pulses, respectively, excluding the normalization point. The vertical arrow to the right of the graph indicates the alternation depth of 0.19. C: Normalized ECAP amplitudes at 210 CL for 3500 pps in the same subject. The horizontal black line indicates the adaptation index of 0.31, which was obtained by averaging the normalized amplitudes across pulses 2–13.

