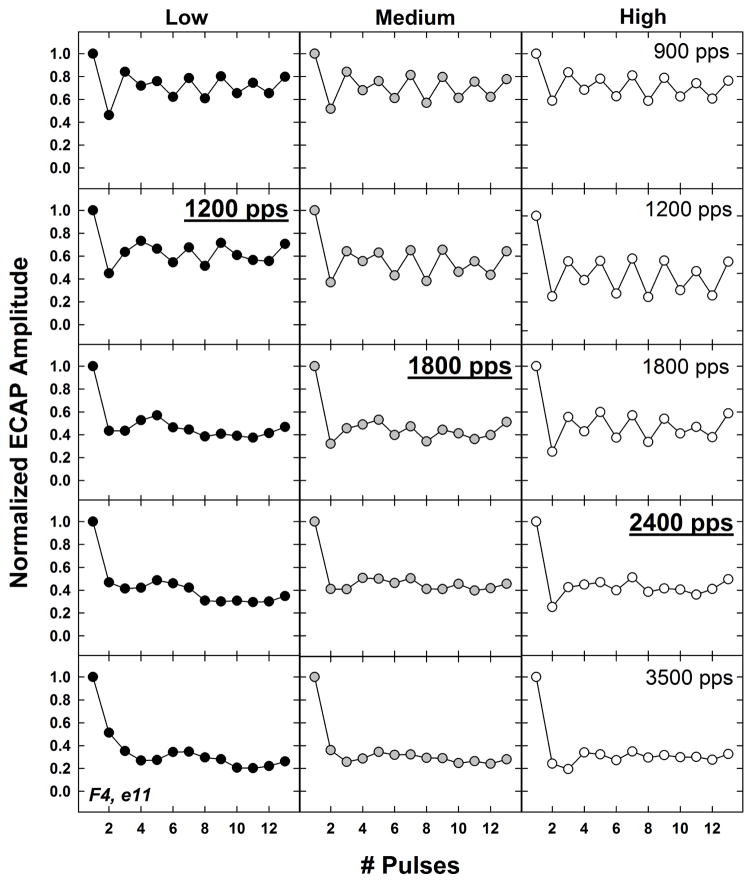
Fig. 5.
Individual example showing normalized ECAP amplitudes as a function of pulse number for low, medium, and high stimulus levels (left to right columns, respectively). Rows represent data for the slowest rate (900 pps, top) to the fastest rate (3500 pps, bottom). In each column (level), the stochastic rate is indicated with boldface and underline. Data are from electrode 11 in subject F4.

