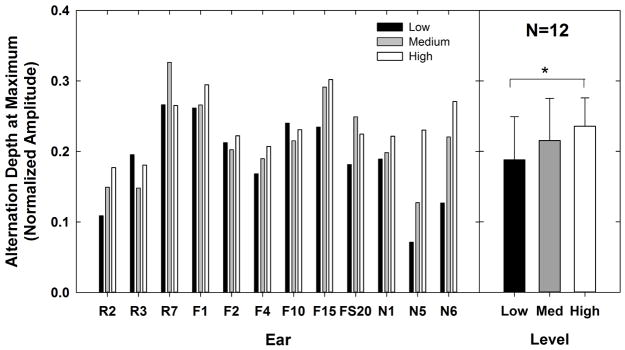
Fig. 7.
Left: Individual data showing the alternation depth measured at its maximum for each subject and level. Low, medium, and high levels are indicated by black, gray, and white bars, respectively. Right: group mean (bar height) alternation depth for each level (lines represent +1 SD). Significant differences are indicated by the bracket and asterisk.

