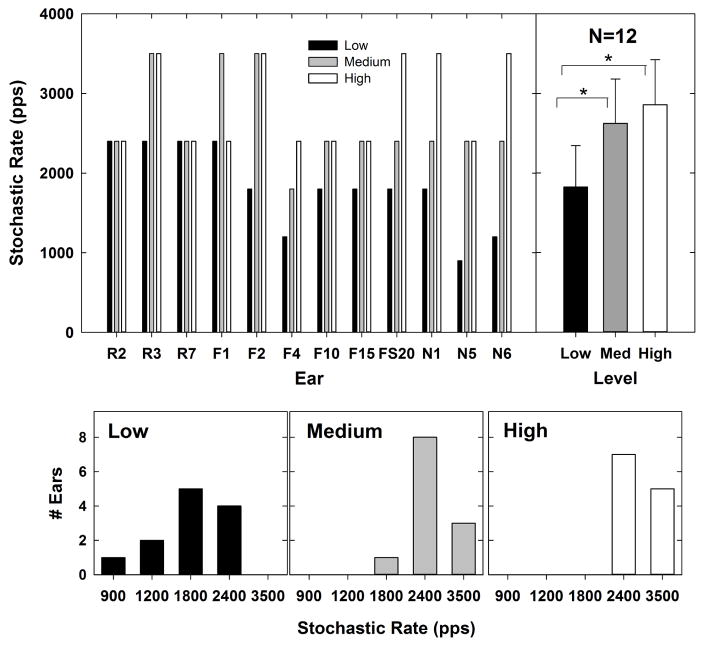
Fig. 8.
Top left: Individual data showing the rate at which the alternating pattern ceased (stochastic rate) for each subject and level. Data are plotted similar to Fig. 6. Top right: group mean (bar height) stochastic rates for each level (lines represent +1 SD). Significant differences are indicated by brackets and asterisks. Bottom row: histograms for low to high stimulus levels (left to right, respectively) indicating the number of ears that exhibited each stochastic rate.

