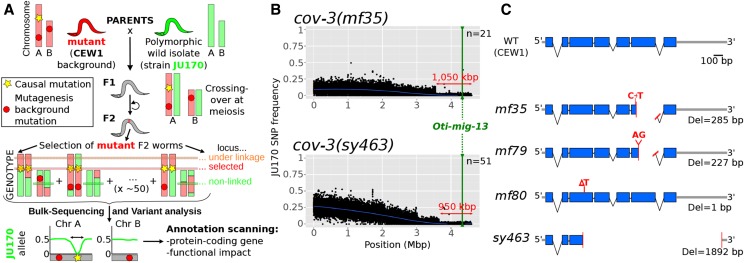
Figure 2.
Mapping-by-sequencing of O. tipulae vulva mutants and identification of cov-3 mutations in the Oti-mig-13 gene. (A) Principle of the mapping-by-sequencing approach, involving the wild isolate JU170 as a mapping strain and whole-genome resequencing of a bulk of mutant F2 grand-progeny (see text for details). The phenotype-causing mutation is mapped genetically by the cross as the region of low frequency of JU170 alleles. Final identification requires scanning of this interval for variations specific to the mutant background. (B) JU170 allele frequency plots in scaffold 1 (genome version nOt.2.0.) in bulk-sequencing data generated with the independent cov-3 alleles mf35 and sy463 (upper and lower plots respectively). On each plot, the blue line is a local regression of the JU170 allele frequency, the red arrow indicates the mapping interval size, the green line the position of the mig-13 gene, and n the number of F2 lines pooled in each mapping population. (C) Cartoon depicting the structure of the wild-type Oti-mig-13 gene and the alterations found in all independent alleles isolated so far. Mutations are indicated in red, exons are blue boxes, introns thin black lines, and intergenic regions thick gray lines. Del, deletion; WT, wild type.

