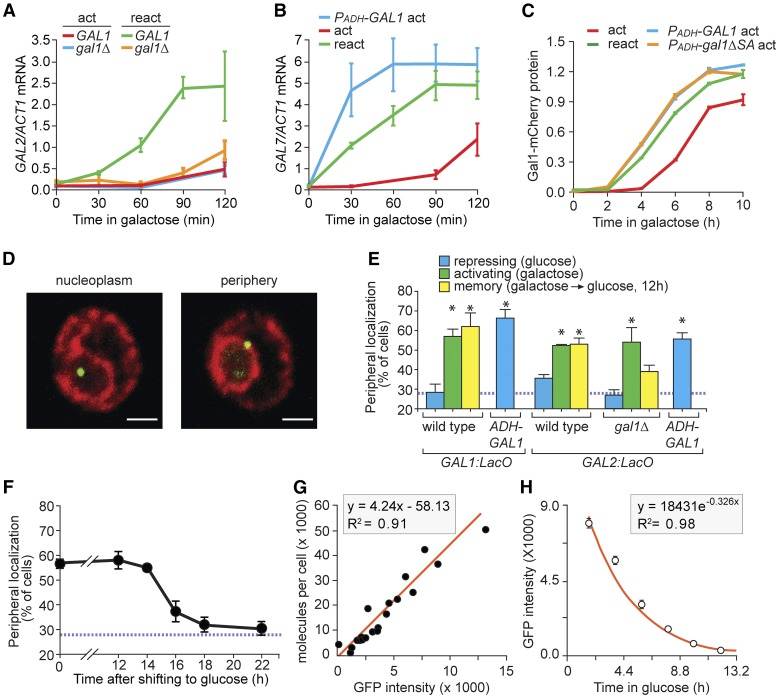
Figure 1.
Gal1 promotes GAL gene localization at the nuclear periphery during memory. (A–C) Cells were shifted from glucose to galactose (act; activation) or grown overnight in galactose, shifted to glucose for 12 hr and then shifted to galactose (react; reactivation). Cells were harvested at the indicated times, RNA was prepared and mRNA levels were quantified relative to ACT1 by reverse-transcriptase quantitative PCR (RT qPCR) (A and B) or fluorescence was quantified using flow cytometry (C). (A) GAL2 activation and reactivation in wild-type and gal1∆ cells. (B) GAL7 activation and reactivation or activation with PADH-GAL1. (C) Gal1-mCherry levels, normalized to constitutively expressed cyan fluorescent protein (CFP) (PTDH-CFP) during activation, reactivation, and activation in cells with ectopically expressed wild-type GAL1 (PADH-GAL1) or catalytically inactive mutant (PADH-gal1-∆SA). (D) Immunofluorescence images of cells having the LacO array integrated downstream of the GAL1 gene, stained for GFP-LacI (green) and Sec-63myc (red) and scored as either nucleoplasmic or peripheral. Bar, 1 µm. (E) Peripheral localization of GAL1 and GAL2 under repressing (glucose), activating (galactose), and memory (galactose → glucose, 12 hr) conditions in wild-type or gal1∆ cells and in the presence of PADH-GAL1. (F) Cells with the LacO array downstream of GAL1 were shifted from galactose to glucose media for the indicated length of times and the percentage of cells in which GAL1 colocalized with the nuclear envelope was plotted. The hatched blue line in (E and F) represents the baseline colocalization predicted by chance (Brickner and Walter 2004). (G) Plot of the fluorescence intensities of 20 GFP-tagged proteins (Ghaemmaghami et al. 2003; Huh et al. 2003), measured by flow cytometry, against protein copy number per cell (Newman et al. 2006). (H) Gal1-GFP fluorescence decay after shifting from galactose to glucose. Note: to avoid potential effects of continued translation and maturation of GFP, the initial point for curve fitting was 2 hr after repression. Error bars represent SEM for ≥ three biological replicates. Each replicate for localization (E and F) consisted of 30–50 cells and for fluorescence estimation using flow cytometer (C, G, and H) consisted of ≥ 5000 cells, respectively. * P ≤ 0.05 (Student’s t-test) relative to the repressing condition.

