Figure 3.
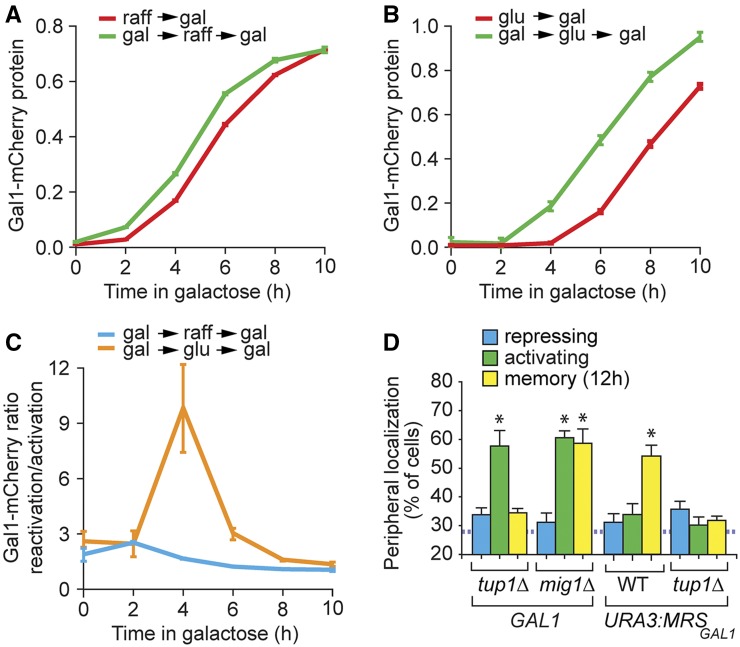
The adaptive value of memory in cells grown in nonrepressing and repressing carbon sources. (A and B) Gal1-mCherry expression during activation and reactivation, measured by flow cytometry. Activation: cells were shifted to galactose (gal) from either a nonrepressing carbon source, raffinose (raff) (A), or a repressing carbon source, glucose (glu) (B). Reactivation: cells were shifted from gal to either raff (A) or glu (B) for around seven cell divisions and then reactivated in galactose. (C) Gal1-mCherry reactivation:activation ratio at the indicated time points after shifting cells from raffinose to galactose or glucose to galactose. (D) Peripheral localization of GAL1 or URA3:MRSGAL1 in tup1∆ and mig1∆ mutant strains. The hatched line represents the level of colocalization with the nuclear envelope predicted by chance. WT, wild type. * P ≤ 0.05 (Student’s t-test) relative to the repressing condition. Error bars represent SEM for at least three biological replicates.

