Figure 5.
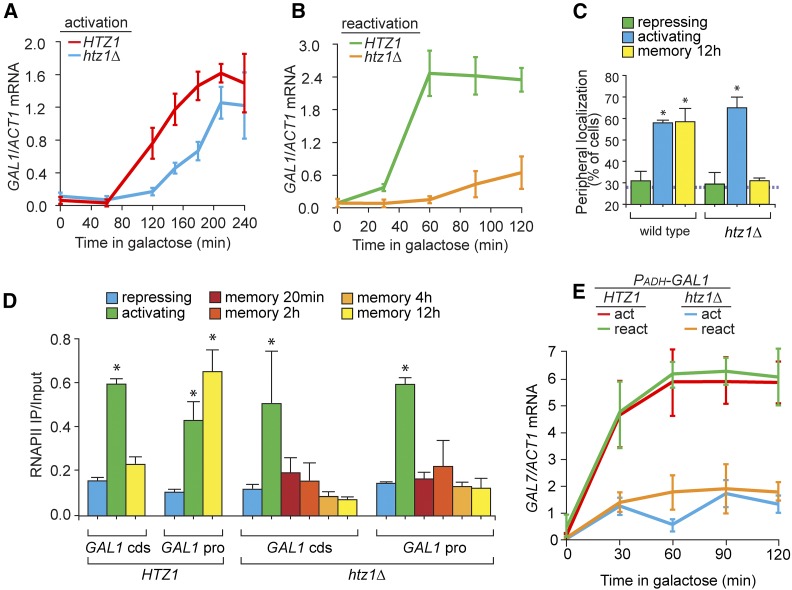
H2A.Z functions downstream of Gal1 to promote GAL transcriptional memory. (A and B) GAL1 expression, relative to ACT1, measured by RT-qPCR over time in wild-type and htz1∆ cells during activation (A) and reactivation after 12 hr of repression (B). (C) Peripheral localization of GAL1 under repressing (glucose), activating (galactose), and memory (galactose → glucose, 12 hr) conditions in wild-type and htz1∆ cells. The hatched line represents the level of colocalization with the nuclear envelope predicted by chance. (D) RNAPII ChIP from wild-type and htz1∆ cells under repressing, activating, and at different times during memory (galactose → glucose, 20 min to 12 hr) conditions. (E) GAL7 expression, relative to ACT1, measured by RT-qPCR during activation or reactivation in wild-type and htz1∆ cells transformed with PADH-GAL1. Error bars represent SEM from at least three independent replicates. * P ≤ 0.05 (Student’s t-test) relative to the repressing condition. cds, coding sequence; ChIP, chromatin immunoprecipitation; pro, promoter; qPCR, quantitative PCR; RNAPII, RNA polymerase II.

