Figure 16.
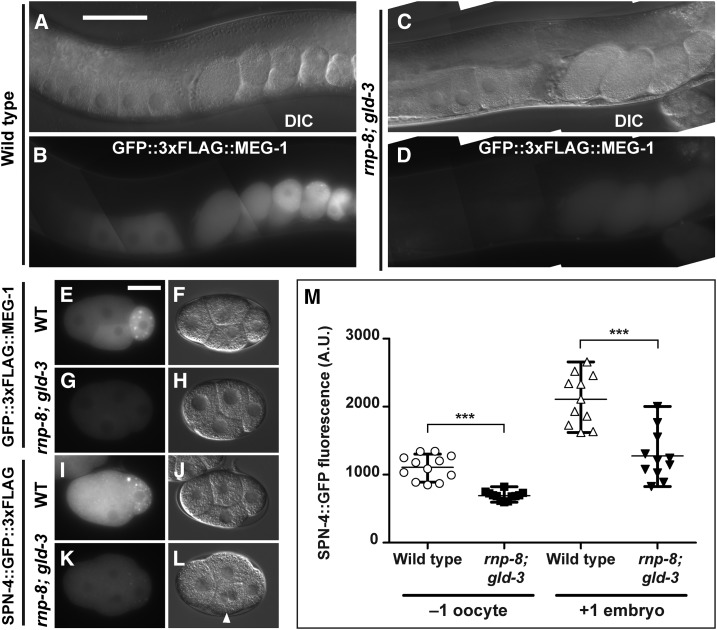
MEG-1 and SPN-4 are expressed at lower levels in oocytes and embryos in rnp-8; gld-3 double mutants. Paired DIC and fluorescence images showing (A–D and E–H) GFP::3xFLAG::MEG-1 expression using the meg-1(tn1724) edit and (I–L) SPN-4::GFP::3xFLAG expression using the spn-4(tn1699) edit in wild-type genetic backgrounds or the rnp-8(tm2435); gld-3(q730) double null mutant background. (L) An arrowhead indicates an embryonic blastomere with multiple nuclei. (M) Quantification of SPN-4::GFP::3xFLAG fluorescence levels (arbitrary units) in the −1 oocyte and +1 embryo in a wild-type genetic background or the rnp-8(tm2435); gld-3(q730) double null mutant background as indicated. An unpaired t-test with Welch’s correction for unequal variance indicated *** P < 0.0001 for the comparisons. A similar level of significance was also observed without the Welch correction. The strains used in this figure are: DG4158, DG4363, DG4213, and DG4366. (A–D) Bar, 50 μm. (E–L) Bar, 20 μm.

