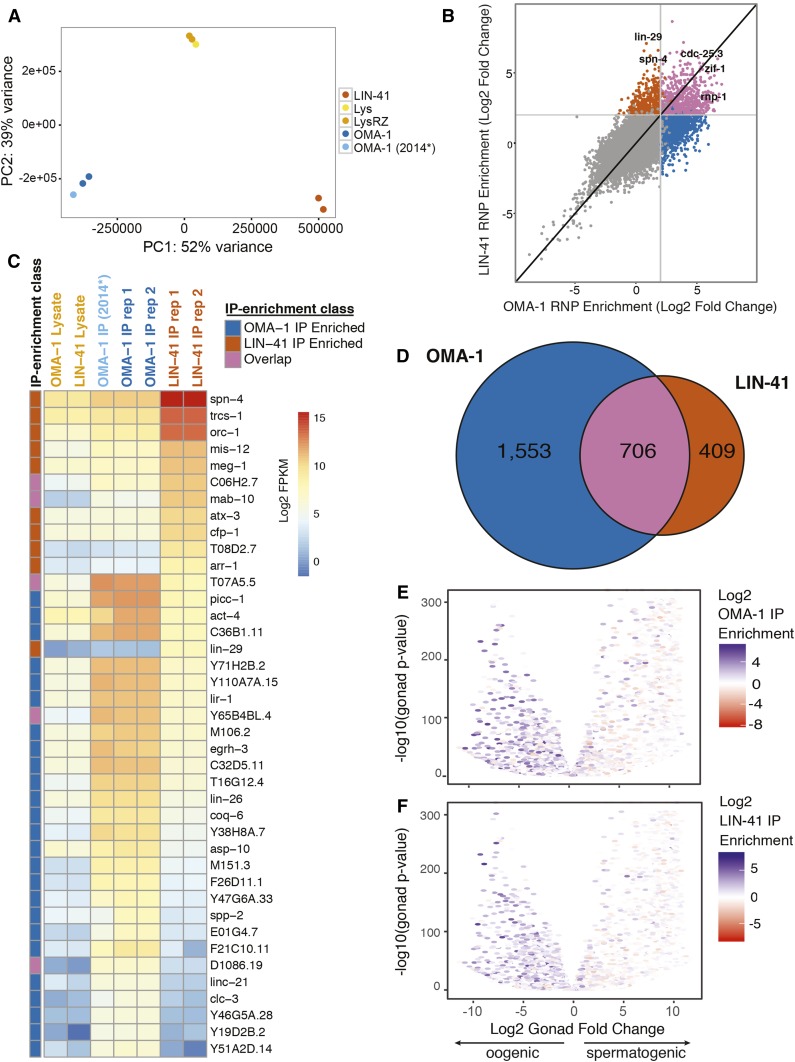
Figure 4.
Characterization of LIN-41- and OMA-1-associated RNAs. (A) PCA comparison of LIN-41- and OMA-1-associated RNA purifications. The Ribo-Zero-depleted lysates (LysRZ) and untreated lysates (Lys) are indicated. OMA-1 (2014*) is the RNA-seq data set of OMA-1-associated mRNAs reported previously (Spike et al. 2014b). (B) Distribution of mRNAs according to their enrichment in the LIN-41 and OMA-1 immunopurifications. (C) Heat map showing the abundance of the 40 most differentially enriched transcripts in the immunopurifications above a threshold of 50 FPKM in one of the immunopurifications. (D) Venn diagram showing the overlap between LIN-41- and OMA-1-associated RNAs with a fourfold enrichment cutoff. (E and F) The distribution of (E) OMA-1-associated and (F) LIN-41-associated transcripts according to their enrichment when the gonad is oogenic vs. spermatogenic. Negative and positive values indicate enrichment in the oogenic and spermatogenic gonad, respectively. The volcano plots show the Log2FC in the ratio of expression in fem-3(q96gf) spermatogenic gonads vs. fog-2(q71) oogenic gonads on the x-axis and statistical significance on the y-axis using the data from Ortiz et al. (2014). PC, principal component.

