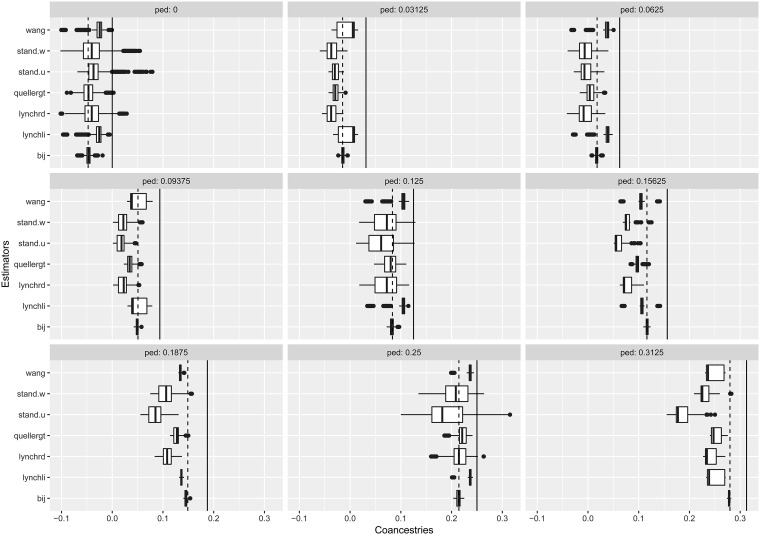
Figure 8.
Boxplots of coancestry estimates for seven alternative estimates, displayed according to nine pedigree values. Vertical solid black line on each panel shows the pedigree coancestry, and vertical dashed line shows the mean-adjusted pedigree coancestry (see text). Estimators are defined in Table 6. shows very good statistical properties for all mean-adjusted pedigree coancestries.

