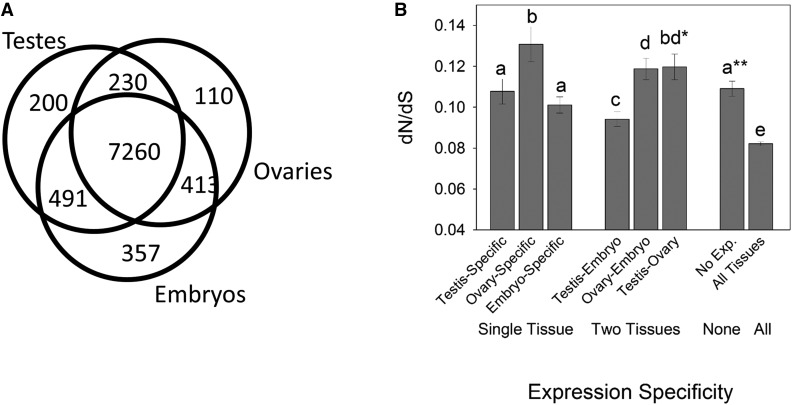
Figure 4.
(A) The number of genes expressed in testes, ovaries, and embryos in A. aegypti among the 9389 genes under study (328 CDS had no expression). (B). The mean dN/dS of genes for tissue-specific (single tissue) and genes coexpressed (two tissue types or all three), and those not expressed in any tissues (none). Standard errors are shown in error bars. Different letters above any two bars indicate a statistically significant difference (P < 0.05) between those dN/dS values, using a paired Mann-Whitney U (MWU)-test (note that P was < 0.01 for all paired contrasts). *The ovary-specific and testis-ovary dN/dS did not differ across all genes per group (MWU-test P > 0.05), but the former had higher values using contrasts of values above the median (P < 0.001). No difference was observed between CDS coexpressed in ovary–embryo vs. testis–ovary as denoted by the same letter (d) in both categories. **No expression (No exp.) exhibited no difference in dN/dS as compared to testis-specific CDS, but was different from embryo-specific CDS. CDS, coding sequences; dN/dS, nonsynonymous to synonymous substitution rates.

