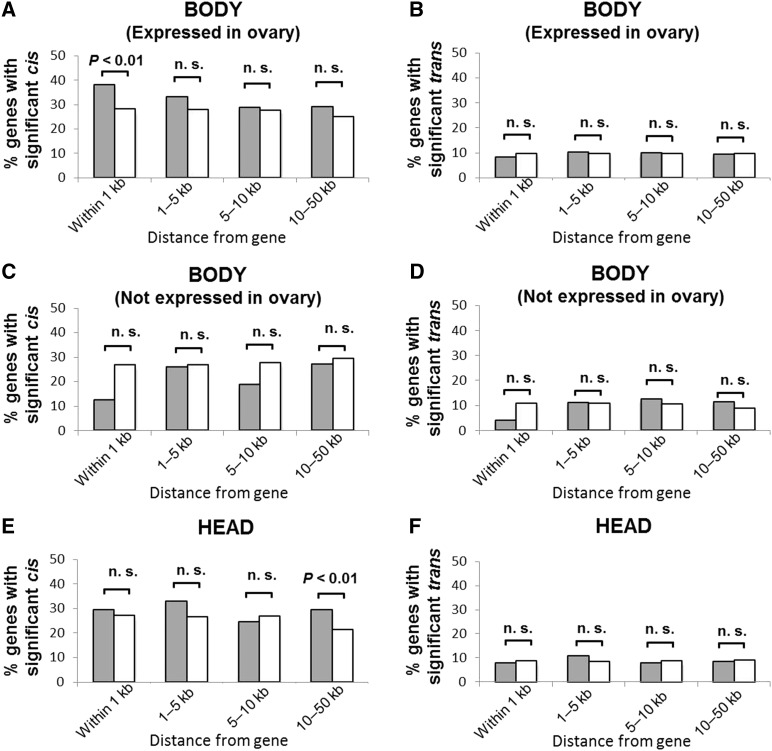
Figure 2.
Proportion of genes that showed significant cis- or trans-regulatory contribution to expression variation. The proportion of genes with (shaded bar) or without (open bar) TE insertions within various distances that showed significant cis-regulatory variation in (A) body genes expressed in the ovary (N = 3312), (C) body genes not expressed in the ovary (N = 412), and (E) head genes (N = 3213). Additionally, genes that showed significant trans-regulatory variation in (B) body genes expressed in the ovary, (D) body genes not expressed in the ovary, and (F) head genes. P-values after Bonferroni correction for multiple (four) tests using χ2-tests are shown. n.s., nonsignificant pairs.

