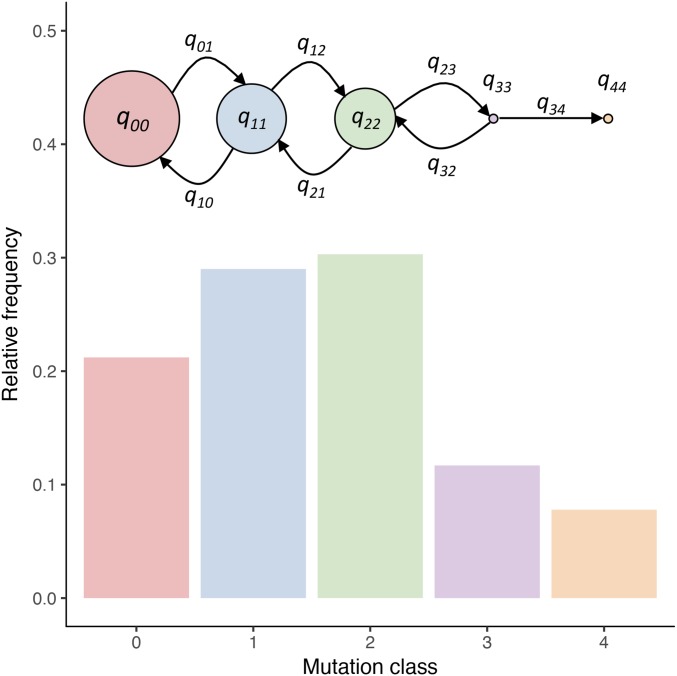
Figure 1.
Exemplar results for a quasispecies model. For a mutation rate of and the fitnesses as given in Table 2 (1 + scaled duplication rate), we illustrate the equilibrium distribution of the relative frequencies of P. fluorescens SBW25 REPINs. The radii of the circles indicate the duplication rate (see Equation 2). Note that the actual fitness differences are extremely minute at the level of The cartoon merely illustrates the architecture of the fitness landscape. The mutation probabilities are given by while self-replication occurs with probability

