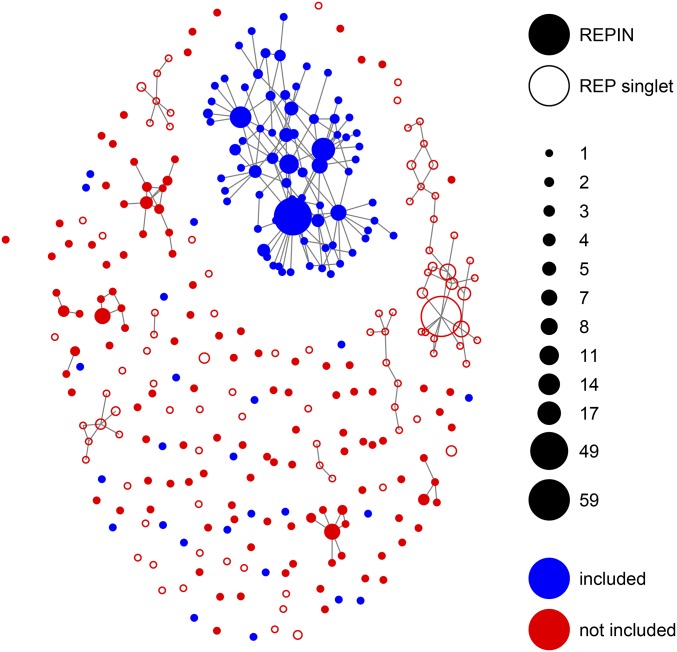
Figure 2.
Structure of the REPIN population in SBW25. REPINs that differ in exactly one position are connected. REP sequences that do not form REPINs (e.g., singlets) are shown as ○. Blue included nodes belong to the REPIN population for which we infer duplication rates. Red (“not included”) nodes were excluded from the analysis because they likely evolve on a more complex fitness landscape that is more difficult to model. The size of the nodes indicates the frequency of the corresponding sequence in the SBW25 genome.

