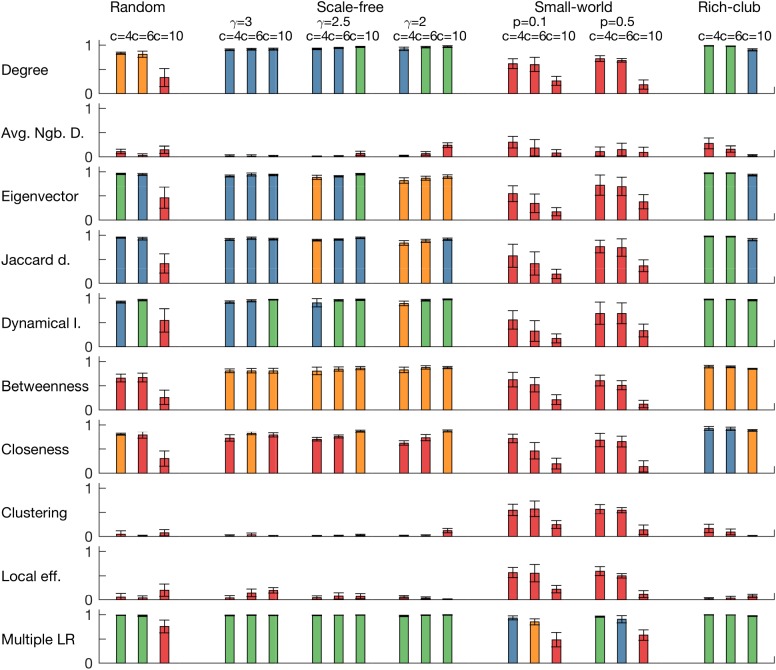
Fig 6. Coefficient of determination (R2) of linear regressions of NI for a set of node measurements applied in different network topologies for the CM.
Each row corresponds to a node measurement (degree, average neighbour degree, eigenvector centrality, eigencentrality based on Jaccard dissimilarity, dynamical importance, betweeness centrality, closeness centrality, clustering coefficient, and local efficiency), whereas each column corresponds to a different network topology (within topologies, we present results for three different mean degrees). The last row is the R2 of a multiple linear regression combining all measurements. Eigenvector centrality, eigencentrality based on Jaccard dissimilarity, and dynamical importance are the node measures whose correlation with NI is higher. Colour code: green corresponds to R2 > 0.95; blue to 0.90 < R2 ≤ 0.95; orange to 0.80 < R2 ≤ 0.90; and red to R2 ≤ 0.80. All networks are undirected and parameter choices are as in Fig 4.

