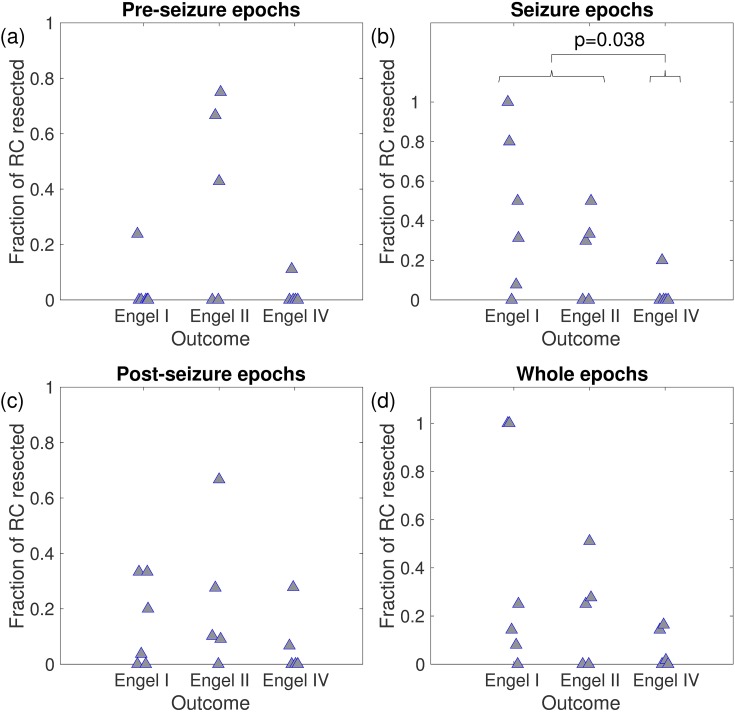
Fig 9. Fraction of rich-club (RC) resected versus seizure outcome for 16 patients.
Panels (a), (b), (c), and (d) correspond to a quantification based on functional networks derived from pre-seizure, seizure, post-seizure, and whole epochs, respectively. Braces indicate the p-value of Kruskal-Wallis one-way analysis of variance to quantify the statistical difference between good and bad responders.

